Standard Error of the Mean in Excel

HTML-код
- Опубликовано: 1 окт 2024
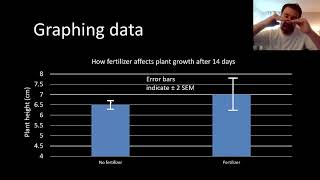
- This video shows Dr. Evan Matthews explaining how to calculate a standard error of the mean in Excel. The sample data in this video represents the heart rate of several participants at rest and during increasing levels of exercise intensity.
Calculate an average in Excel.
• Calculating Averages i...
Standard Deviation in Excel
• Standard Deviation in ...
Excel Skills Playlist
• Excel Microsoft Office
Link to Dr. Evan Matthews website.
sites.google.c...


![NOSFERATU - Official Trailer [HD] - Only In Theaters December 25](http://i.ytimg.com/vi/nulvWqYUM8k/mqdefault.jpg)


man's unknowingly saving students' research time
Happy to help.
Omg, thank you so much! It helped me A LOT! best video, direct to the point and easy to understand! Thank you, really! :)
Fantastic, exactly what I was looking for. Short and to the point. You rock!
Glad it helped
If I could like this twice I would - thanks!
I'm glad it was helpful.
I think it is wrong. Standard error of the mean is Std.population/Sqrt(n).
Hi Anthony. On a quick search of standard error of the mean equations online, I see the same equation you are citing here (using the population standard deviation equation instead of the sample standard deviation equation within SEM calculations). I am not a statistician. I am an end user of stats, so I am not 100% sure which is best. My rationale for using the standard deviation of the sample instead of standard deviation of the population within the SEM equation is because I have a sample that I am attempting to generalize to the population. Generally speaking, using the standard deviation of the population equation when you are inferring information about the population based on a sample will result in a smaller estimate of SEM. For the rest time point in the video above you would get a SEM using the standard deviation of the population of 3.48. Using the sample standard deviation equation gives a more conservative (larger value) for SEM. See the websites below for additional details. I also reached out to a biostatistician from my university to double check my thought process here. She said, "What you did is correct. The population standard deviation is usually unknown, the sample standard deviation is an estimate of it."
If you have some quality resources on this topic or a counter argument please share them here. Thanks for the thought provoking comment.
statistics.laerd.com/statistical-guides/measures-of-spread-standard-deviation.php
www.graphpad.com/support/faqid/1383/
thx blood
If my sample size is small, should i do normality test, why?
Hi @fatimaothman1241. Best practice is to always do a normality test when doing parametric statistics. This is because parametric inferential statistics tests assume a normal distribution of the data. I do not believe SEM relies on a normal distribution, but I could be wrong. I'm not a statistician. Hopefully someone else well answer. If you find a definitive answer please respond back to this comment so I know too. Thanks.
7 years later and still a quick, simple, to the point, amazing demonstration. What a Legend. Thank you my friend
You are welcome!
Thank You, Sir, for short and Simple explanation.
Really saving a lot of time. Thanks
You are welcome.
Any ebook one can recommend for the SEM?
Not that I know of sorry.
Hi Evan, thank you for the explanation. I have seen some of your other videos about how to present data like in research papers and it was really a great help!
I have a question concerning the calculation of SEM when I want to transfer my raw data to % normalized to control, but I don't know how to convert the SEM so that it matches the figure. I have seen it on other papers, where SEM or SD values were depicted on the %normalized bar.
I'm unfamiliar with this, so I don't think I can be much help. Sorry.
Hi Evan. Great video! I had a quick question about what to do for calculating the SEM in a different circumstance in regard to the sample. So I have my total sample (n = 71); however this sample has been split into 5 different groups (n = 15, 14, 15, 13, 14) respectively. When calculating SEM for the n=15 group for example, do I use the total sample (stdv(of each group)/'root'71) ) or (stdv(ofeachgroup)/'root'15). I'm really confused what to use!
Also, if there are outliers/anomolous results in my data, do I discount these from my calculation of my mean, and subsequent SEM?
Just trying to get my dissertation finished and it's stressing me out! Hope you can help. Thank you for the video!
Hi ThroxLoL. The standard error of the mean is essentially a measurement of the accuracy of the mean value calculated. So the SEM value should be calculated using the same data as the mean (i.e., the group data for a group mean and the full sample data for a full sample mean). Whether or not to include potential "outliers" in your data or remove them is a tricky topic. People do not always agree. If you are removing them from your mean calculations you should do the same for your SEM calculation. I will have a video coming out soon talking about one method of detecting potential outliers soon.
JALDI BOL,SUBAH PANVEL NIKALNA HAI BHAI
Please translate to English if possible.
thank you!
ευχαριστωωω ρε αλανι με εσωσεςςςςς
I'm glad it helped.
Greatly appreciate it
You are welcome.
thank you very much sir, you are a true life saver i have subscribed to your channel and i am going to share it right away
I'm glad you're finding it useful.
thank you very much... its short and good.its very helpful me
I'm glad it helped.
Thank you prof 👨🏫
Happy to help.
@@VivoPhys you truly did sir . My first year in college and prof’rs don’t even explain the content .
PERFECT example of how you make a tutorial. Thankytou
You are welcome.
You have just saved my life, thank you!
I'm glad it helped.
Thank you for simplest explanation.
I'm glad it helped!
sir, why is my SEM range from 0-0.1?
If you did it correctly your data must be very close together.
I thought it was Standard Deviation/sqet(sample count -1), not Standard Deviation/sqrt(sample count)?
I think you might be mixing concepts. Look up standard deviation of a sample vs population. I think that's what you are thinking about.
Thank you so much! absolutely fantastic!!!
You are welcome.
Idk why it's so difficult to find a simple answer to a question on Google, this is exactly what I was looking for. So much other incorrect bullshit for some reason
Thank you so much!! You deserve my professors salary lol
I'm glad it helped!
Thank you so much for this video
You are very welcome.
Thanks
You are welcome.
Perfection. Straight to the point
Thank you!
I have 2 sets of data so i need to find SEM between the data so i just get one value of SEM how to calculate it?
I guess you would need to include all the values in the array used in the formula.
Perfect Thank you so much 👌👌
You are welcome.
@@VivoPhys Thank you
Thank you. Thank you. Thank you.
You are welcome!
You hit the point, Dr. Thanks a ton
You are welcome.
You are a lifesaver!
I'm glad it helped.
Thanks
You are very welcome.
Thank you so much yar
Your welcome
your a life saver
I'm glad it helped.
THANK YOU IT WAS REALLY GOOD
Glad you found it helpful!
Perfect
I'm happy it helped!
Many thanks
I'm glad it was helpful.
Brilliant, thanks
I hope it helped.
Thank you! this was a great help
You are welcome!