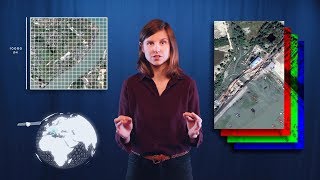
Visualizing multi-band satellite images in Python

HTML-код
- Опубликовано: 16 июл 2024
- In this tutorial, I explain how to visualize multi-band Landsat 8 satellite imagery as true- and false-color composites using Python and matplotlib. The basic procedure is: 1) read individual raster bands as array 2) rescale to 0 and 1 using minimum and maximum values (or percentiles or mean + - standard deviation for contrast enhancement) 3) stack arrays using numpy.dstack 4) plot RGB composite with plt.imshow()
Code:
from osgeo import gdal
import numpy as np
import matplotlib.pyplot as plt
def scaleMinMax(x):
return((x - np.nanmin(x))/(np.nanmax(x) - np.nanmin(x)))
def scaleCCC(x):
return((x - np.nanpercentile(x, 2))/(np.nanpercentile(x, 98) - np.nanpercentile(x,2)))
def scaleStd(x):
return((x - (np.nanmean(x)-np.nanstd(x)*2))/((np.nanmean(x)+np.nanstd(x)*2) - (np.nanmean(x)-np.nanstd(x)*2)))
ds = gdal.Open("Landsat8_20200423_B1-7.tif")
r = ds.GetRasterBand(4).ReadAsArray()
g = ds.GetRasterBand(3).ReadAsArray()
b = ds.GetRasterBand(2).ReadAsArray()
ds = None
rMinMax = scaleMinMax(r)
gMinMax = scaleMinMax(g)
bMinMax = scaleMinMax(b)
rgbMinMax = np.dstack((rMinMax,gMinMax,bMinMax))
plt.figure()
plt.imshow(rgbMinMax)
plt.show()
rCCC = scaleCCC(r)
gCCC = scaleCCC(g)
bCCC = scaleCCC(b)
rgbCCC = np.dstack((rCCC,gCCC,bCCC))
plt.figure()
plt.imshow(rgbCCC)
plt.show()
rStd = scaleStd(r)
gStd = scaleStd(g)
bStd = scaleStd(b)
rgbStd = np.dstack((rStd,gStd,bStd))
plt.figure()
plt.imshow(rgbStd)
plt.show()


Just the tutorial i was looking for. Thank You for such easy to understand tutorial.
Another extremely useful tutorial. Thank you very much!!
Thank you. Keep up the good work of posting such good material.
Thank you very much for your turorial like such, looking forward to some similar ones, best wishes
Your contents is exactly what I want to do and know, plotting given tiff on python. Thanks your great helpful tutorial.
Amazing tutorial thank sooo much!!
Awesome video. Thanks a lot.
Great video. Thank you 💕
Hi, very interessing like usual. 👍
Good stuff, appreciated this as this is simple and informative. Congratulations. I use GDAL/Python quite a bit but mostly for single-band WMTS tile generation and image stitching. Some satellite images will require a Gamma filter to brighten the images just before the depth stacking, e.g., ABI sensor.
Perhaps the tutorial will be more useful if you added geographic/geodetic coordinates rather than numeric image coordinates.
Great video! There are so few good tutorials on these topics for beginners. Can I ask which keyboard you use? I really like the sound of the key strokes.
Thank you for this great tutorial! Liked and subbed, but there is something I wonder I'd like to ask you a general question.. Do we really need python for satellite images? or we could do it every single thing on QGIS?
Hey there! Thanks for the awesome tutorial. Just jumping back into using Python for satellite imagery classification. This intro is awesome! Just a question though. If I was going to do some image classification later, the rescaled values won't be affecting the classification process, no? I'm relating the process here with how we change the visualizing to have clear satellite image composite in softwares like QGIS and ArcGIS. As far as I remember, it didn't seem to matter. But looking at it in Python...it kinda open that question for me.
Again, awesome tutorial!
Super useful info! Just a problem for me, my np.nan value is shown in black by default. I tried to use cm.set_bad('white', 1.) yet couldn't solve it. Wonder Have you ever come across the same problem? Thank you for your time. :-)
why when I run your code, it appears such errors : 'NoneType' object has no attribute 'GetRasterBand', could you explain it for me a while ! thanks!
Hello
I need are working composite rgb meteosat 8
I really need this video, can you tell me what are the librarys used for split and merge the tiff images without losing the property of tiff images?
Other than cv2 library
With properties, you mean information on the extent, resolution, projection, etc.? I use gdal for merging and splitting raster data. There, the geographic information is maintained.
Where to get the dataset!?
Come back pls!!!
can we find gold with this
Why it is advantageous to use python for image processing?Than QGIS