Matt my man you are godsent angel for dissecting the intricate details , about to start my hedge fund and this is highly valuable content.... God bless you.....
Hi, how can I cite or confirm that the blach sholes derivation you are using for the seed value is applicable to a portfolio VaR monte carlo sim. In otherwords, on what basis did you use that black scholes derivation . Is there somewhere wher i can cite to confirm that this is some market prectice when measure VaR by way of a monte carlo simulation?. thanks
So the formula estimates possible ending values for the securities some time step into the future. The difference between this and BSM is that BSM are valuing a derivative, and so they account for not only the potential price variance and time but also the strike price of the derivative. You might try Glasserman or Hilpisch for reference.
Hi Matt, Thanks for sharing this video! extremely helpful. Would you happen to have any resources or guidance on how to perform Monte Carlo simulation along with DCF and intrinsic valuation? I've been roaming the internet world for something but haven't been able to find something that's easy to follow.
I think I have something where I played around with discounted free cashflow. As I recall I put a normal distribution on growth and the residual value based on estimates of growth and typical residual values as percentage of total value. Maybe I will make a video, but I am not sure when I will get to it.
Hi Matt, Thank you for your video. I would like to know where did the "5" came from in the Black and Scholes model. Jorion in equation 12.4 refers to the VaR Horizon that is in your case equal to 21. Thank you for answering. Khaled
Hi there. I think you are referring to the estimate of risk free rate. You can plug in what you want there, but the obvious choice is the current 30-day t-bill. Yes the time horizon in this example is 21/252. You can download the spreadsheet model from the link in the video or the description if you like.
Hey Matt, Is it a 1 Day VaR or 21 Days VaR. For 1 Day do I need to divide it by square root of 21? Plus for Options Can I take Implied Volatility instead of Historical Volatility for VaR Calculation?
Hi Matt - thanks for this. Does this assume that the expected return is 0% for the 2-asset portfolio? Or the better question may be: how does the incorporate the expected return of the 2-asset portfolio?
In general the expected return would be the risk-free rate. I think it was pretty close to 0 when I made this but you can adjust accordingly. One-month t-bill currently at 0.13%!
Hi Matt, Your video helped me a lot. But what bothering me now is about writing the methodology for this? Did anyone write any methodology based on the given video?
Hello Matt, Is the portfolio value the value of the call option obtained from the black scholes model or the current value of the underlying asset? Thank you!
Hi, I made a pivot table with the change in values and in rows, then right-click over the left column and select group. It may be easier to watch this: ruclips.net/video/xEWBNRFitxI/видео.html
@@MattMacarty hey matt..could you please elaborate how and why did you take 0.5 ? What do you mean same as variance/2 ? I'm doing var calculation for 5 stocks for a project and would really appreciate your reply. Thanks.
@@MattMacarty why the mu equals to risk free rate minus 0.5*variance but not a plus for the return? and which page on the Jorion book can I find the exponential derivation please?
Thanks. So you have a couple of options. What you need is to calculate the variance using 3 securites, and so you can expand the variance calculation to include the wieghts of three instead of two , and add covariance terms for the new securities, or you can use matrix multiplication to arrive. See this video which covers portfolio variance: ruclips.net/video/5wresdHooHQ/видео.html
Thank you so much man. How would the formula differ when forecasting options? I used implied volatility instead of standard deviation and the results seem realistic. Let me know if you think that would make for a realistic option simulation. Also, where did you get the derivation of the Black Scholes formula? (Referencing purposes)
Yes standard deviation really is historical volatility. Generally, you also include the risk-free rate in options valuation. You can also include rfr in VaR, but it doesn't change it much.
@@MattMacarty Thank you. When running a simulation for a single call option portfolio, should I use the Call option premium as the portfolio value or should I use the value of the underlying shares?
hello, thank you so much for your video, If I only have a single stock, how can I find the Monte Carlo simulation of value at risk in excel pls? Thank you
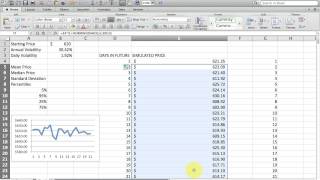
Thanks for the great video really! I have two question, please! 1) the formula from 1:37, in F4, exp( ... ) , what is its result? it's return or it's price? or it's (1+ return)? 2) at the end seems it's return in B13, and if it's positive, why it's interpreted as loss? isn't it profit? (95% confident profit will > C13) . also from your histogram , your mean is around 0.97ish, not zero, then if you go left 2 standar dev, it's still positive. In general how to interpret this? Thank you very much!
It's where the portfolio ends as a proportion of it's starting value. So in that first example it's 0.98 ish and this means the portfolio lost about 2% , so yes it's (1+ return).
Matt Macarty The thing is - I would like to create a loss distribution and then determinate EC using different alphas. As I dont have enough data, I would like to use Monte Carlo simulation to do it. This is described in International Journal of Economics, “Measuring economic capital using loss distributions” by Osei Antwi and Alice Constance Mensah. For now, I try to figure out how to simulate data that I can use to create a loss distribution plot. :(


Matt my man you are godsent angel for dissecting the intricate details , about to start my hedge fund and this is highly valuable content.... God bless you.....
Thanks. Glad it helped.
Hi Matt,
Really appreciate the work you have done here. It helps a lot!Keep up
Thanks. Glad it helped
Hi, how can I cite or confirm that the blach sholes derivation you are using for the seed value is applicable to a portfolio VaR monte carlo sim. In otherwords, on what basis did you use that black scholes derivation . Is there somewhere wher i can cite to confirm that this is some market prectice when measure VaR by way of a monte carlo simulation?. thanks
So the formula estimates possible ending values for the securities some time step into the future. The difference between this and BSM is that BSM are valuing a derivative, and so they account for not only the potential price variance and time but also the strike price of the derivative. You might try Glasserman or Hilpisch for reference.
thank you for your explanation! May I know what is the reference for calculating the iteration? (referencing purpose)
You mean a reference for the formulation? Value at Risk. Jorion.
Hi Matt,
Thanks for your video, it helps a lot ! I'd just like to know where does the function in the exp come from ?
You use exp to calculate an ending value based on continuous rate of return.
Hi Matt,
Thanks for sharing this video! extremely helpful. Would you happen to have any resources or guidance on how to perform Monte Carlo simulation along with DCF and intrinsic valuation? I've been roaming the internet world for something but haven't been able to find something that's easy to follow.
I think I have something where I played around with discounted free cashflow. As I recall I put a normal distribution on growth and the residual value based on estimates of growth and typical residual values as percentage of total value. Maybe I will make a video, but I am not sure when I will get to it.
@@MattMacarty thank you very much! I think that video will be the first. I wasn't able to find any videos here
Hi Matt, Thank you for your video.
I would like to know where did the "5" came from in the Black and Scholes model. Jorion in equation 12.4 refers to the VaR Horizon that is in your case equal to 21. Thank you for answering.
Khaled
Hi there. I think you are referring to the estimate of risk free rate. You can plug in what you want there, but the obvious choice is the current 30-day t-bill. Yes the time horizon in this example is 21/252. You can download the spreadsheet model from the link in the video or the description if you like.
hi very helpful video...silly question but why do you take away from the risk free rate?
You want to isolate the risk premium.
Hey Matt, Is it a 1 Day VaR or 21 Days VaR. For 1 Day do I need to divide it by square root of 21? Plus for Options Can I take Implied Volatility instead of Historical Volatility for VaR Calculation?
Hi. I would just adjust the time horizon to 1/252 rather than doing any division. You can use implied volatility.
Hi Matt - thanks for this. Does this assume that the expected return is 0% for the 2-asset portfolio? Or the better question may be: how does the incorporate the expected return of the 2-asset portfolio?
In general the expected return would be the risk-free rate. I think it was pretty close to 0 when I made this but you can adjust accordingly. One-month t-bill currently at 0.13%!
please Sir, ma question is how do you calculate the experience expected volatility (0.2651)?
I used the weighted portfolio formula. Take a look at this video: ruclips.net/video/5wresdHooHQ/видео.html
Hi thank you so much for this video it realy help me a lot . I need var monte carlo simulation in R code if you can please help with it thank you ❤️
I have a Python video, but nothing for R. Maybe my next video.
Hi Matt, Your video helped me a lot. But what bothering me now is about writing the methodology for this? Did anyone write any methodology based on the given video?
Yes, there are many academic papers out there. My reference is a fairly older text by Jorion 2007.
Hi Matt, I have 255 trading days, do I still do 255/252? and is it normal for the percent loss of 99% confidence level to be 35%? Thanks
Yes, so you will have a little more than a year. It's possible to see a big loss like that particularly in a 1-year time horizon and high volatility.
Thank you
Glad it helped
Hello Matt,
Is the portfolio value the value of the call option obtained from the black scholes model or the current value of the underlying asset?
Thank you!
It's the value of a hypothetical portfolio.
Alright, thank you
can you have an instruction how to automatically create a range at the end of the video to count for the chart?
Hi, I made a pivot table with the change in values and in rows, then right-click over the left column and select group. It may be easier to watch this: ruclips.net/video/xEWBNRFitxI/видео.html
Hi Matt.. Extremely good work.. can you please tell why have you taken 0.5 in the equation - exp((B6-.5)....?
It's the same as variance / 2
@@MattMacarty hey matt..could you please elaborate how and why did you take 0.5 ? What do you mean same as variance/2 ?
I'm doing var calculation for 5 stocks for a project and would really appreciate your reply.
Thanks.
here B7 is your Std Dev so B7^2 becomes variance....then why are you multiplying that with 0.5 before minus-ing that from risk free rate....
@@sudiptadebnath6335 Yes this is the same as variance / 2
@@MattMacarty did you take.5 as you took two stocks?
Hey Matt. Thanks for the video. If I wanted to do the same for climate value at risk, do you have any ideas, how I would do that?
Do you mean climate as in climate change?
@@MattMacarty Yes
Could you tell me the reference for your Black Scholes Formula? That`d be very much appreciated.
Value at Risk. Jorion, P 2006.
@@MattMacarty why the mu equals to risk free rate minus 0.5*variance but not a plus for the return? and which page on the Jorion book can I find the exponential derivation please?
Hey Matt,
Great video! How can I calculate the VaR of a portfolio containg 3 securities using a Monte Carlo Simulation?
Thanks. So you have a couple of options. What you need is to calculate the variance using 3 securites, and so you can expand the variance calculation to include the wieghts of three instead of two , and add covariance terms for the new securities, or you can use matrix multiplication to arrive. See this video which covers portfolio variance: ruclips.net/video/5wresdHooHQ/видео.html
Thank you so much man. How would the formula differ when forecasting options? I used implied volatility instead of standard deviation and the results seem realistic. Let me know if you think that would make for a realistic option simulation. Also, where did you get the derivation of the Black Scholes formula? (Referencing purposes)
Yes standard deviation really is historical volatility. Generally, you also include the risk-free rate in options valuation. You can also include rfr in VaR, but it doesn't change it much.
@@MattMacarty Thank you. When running a simulation for a single call option portfolio, should I use the Call option premium as the portfolio value or should I use the value of the underlying shares?
So I would use the price of a single share. What you are trying to estimate is the option premium.
hello, thank you so much for your video, If I only have a single stock, how can I find the Monte Carlo simulation of value at risk in excel pls? Thank you
You just replace the portfolio volatility with the expected individual stock volatility.
Thanks for the great video really! I have two question, please!
1) the formula from 1:37, in F4, exp( ... ) , what is its result? it's return or it's price? or it's (1+ return)?
2) at the end seems it's return in B13, and if it's positive, why it's interpreted as loss? isn't it profit? (95% confident profit will > C13) . also from your histogram , your mean is around 0.97ish, not zero, then if you go left 2 standar dev, it's still positive. In general how to interpret this?
Thank you very much!
It's where the portfolio ends as a proportion of it's starting value. So in that first example it's 0.98 ish and this means the portfolio lost about 2% , so yes it's (1+ return).
@@MattMacarty Thanks a lot for confirming! Yes I figured that way.
Hi, thank for your video
can I ask you some question ,if I have 3 security how I find expected volatility? thank
Take a look at this: ruclips.net/video/5wresdHooHQ/видео.html
It is possible to use this method for VAR for foreign currency exchange ?
Yes you can use the same technique. You just need a measure of volatility.
Hi! Have you any idea how to calculate ES (expected shortfall) based on Black-Scholes model?
I will see if I can put something together.
Hello Matt, very nice vid. But I still can't make the histogram, wish can you help me! thanks
Thanks. What is not working?
hallo im from indonesia... can u help me, how to count expected Volality?
thank u
Hi. Take a look at this video, I think this is what you are looking for: ruclips.net/video/5wresdHooHQ/видео.html
how can I create a loss distribution using Monte Carlo simulations?
You should be able to net the VaR by Subtracting starting value from possible ending values.
Matt Macarty The thing is - I would like to create a loss distribution and then determinate EC using different alphas. As I dont have enough data, I would like to use Monte Carlo simulation to do it.
This is described in International Journal of Economics, “Measuring economic capital using loss distributions” by Osei Antwi and Alice Constance Mensah.
For now, I try to figure out how to simulate data that I can use to create a loss distribution plot. :(