Magnificent tutorial: you didn't get bogged down in the details of why cVaR is calculated in a certain, instead, choosing to explain the mechanics of how to compute it in a certain way. Well done dude.
sorry to be off topic but does anybody know of a way to get back into an Instagram account..? I stupidly lost my login password. I would love any tricks you can give me
Nice video. Very fast compared to doing it by hand, so long as you understand the details in-between then all is good here. Nice refresher for single return without accounting for monetary weight.
Hello! Great Video! How did you paste all the return formula down the column(2:25 in the video)? You clicked something(2:50), to drag the formula down the enitre column. How did you do that?
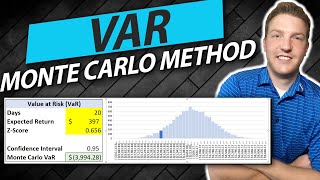
Great question! If you are using daily returns, you can "scale" you VaR numbers by multiplying by the square root of time (VaR(95)*sqrt(n)). However, if you scale this for too long of a period, this has been shown to be quite an inaccurate assumption. Otherwise, you could use n-day returns and run VaR numbers on those returns. Or Monte-Carlo simulations!
use have to use square root rule of time and assume returns are IID. HS method cannot adjust to that as it makes no assumption about the shape of the distribution of the return curve.
Thank you for showing this. Could you extend the concept to the portfolio where there are multi-assets with correlation? The example you are given is based on the historical data (back forward-looking), can you share some method to be used for simulating the data in the future to do a forward-looking VAR calculation? Also, what are the kinds of VAR that big banks and asset management companies are using? Thanks!
Hi. How it would be possible to calculate the VAR for a company which holds money in a bank account? It would make sense to assess the bank financial soundness, calculating the CAP ratio e than calculating the VAR for that company? what formula might be applied for this kind of calculation? thanks!
Hello! Is it possible to calculate the CVar with a span of a year or two and how can i change that in excel? I am working on a comparison between the results of the stresstest and the CVar for the european room on how they effect the systemic risk! Do you have some suggestions for me to make an adequat compariosn between those two units of measuring risks?
Hi, may I know what is the source of this and VaR and CVaR calculation? I meant like the books or journal. I want to use this as bibliography in my thesis. Thank you for your help and guidance. The formula is very helpful to me for calculate the VaR and CVaR of daily stock returns.
Hi, so i have weekly (7 days) of carry trade returns. I need to calculate the VaR for 5 days and one month with 99% and 95%. Any suggestions on how i can do that?
Use this method on a generated timeseries in R: quantbros.com/portfolio-single-stock-var-and-cvar-in-r/ We have other tutorials that involve monte-carlo simulations which could help: quantbros.com/parallelized-simple-random-constrained-portfolio-generation/ I'm also currently working on a tutorials aimed at exactly what you're looking for, but it will most likely become a part of my course: www.QuantCourse.com
i cant understand how to use VaR or ES, so its very hard for me to make an example. how to start. can you help me? saying step by step what to do. its very important for me.
Just remember that VaR is an expected loss number. It depends on the context that you're using it in, but if you're adding this to your portfolio value, use a negative number.
The adjusted closing price amends a stock's closing price to reflect that stock's value after accounting for any corporate actions. The closing price is the raw price, which is just the cash value of the last transacted price before the market closes.
Thank you for the video!! :) It's very helpful I was wondering whether it is possible to apply VaR/CVaR to measure credit risk, because what you actually are measuring is market risk, right?
+Melié There are different models used in credit risk and market risk. In market risk, we mostly use VaR/CVaR and stress testing. In credit risk, we use models such as KMV, Altman's Z-score, O-score, Pr of default etc.. The key point is that in market risk, we try to model prices and returns. In credit risk, we model fluctuations in the value of assets, liabilities, cash flows etc.
Isn't this the correct formula for the returns Rt = (Pt - Pt-1)/Pt-1 instead of Rt = (Pt - Pt+1)/Pt+1 ? And the first return should be the undefined value, not the last one? Still the video is helpful, thanks :)
Could you further elaborate how did you arrive at return values? here you have taken the YOY increase of the return, was it mere a reference as that is quite different to that of the return we actually calculate on stocks? Please help.
I would say to account for the dispersion in a normal distribution, and to make it easier when using excel to calculate the probability of said negative outcome with the chosen confidence interval.
thanks for the video, but you're calculating the VAR only based on history data. espacially in banking, there are much more ways how they're doing it. like a monte carlo simulation of the returns and based on that (expected value) they're calculating the VAR. I think the historical way has caused partially the banking crisis. some szenarios are not included in historical data, so running stress tests or other simulations are helpful!
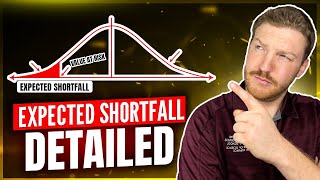
Yes CVAR, ESF Expected short fall, Extreme value loss(derived from EVT - Extreme value theory) and other variants of computing ruin risk (UL -EL) are the same.
So this is the historical method. What about variance and monte carlo methods? I guess they're all flawed so it doesn't really matter which. It's funny how financiers try to make this seem so complicated.
This is wrong at so many levels man. You're not taking into account either the standard deviation, the general return for the portfolio, the weighted composition or anything. You're just saying an 'x' percentile will be your loss because... reasons.
VAR [95] 8.7 VAR [99] 1.74 VAR [99.99] 0.174 these are my number- I have taken 175 observations what will be the VAR @ 99.99% in this case - can anyone help?
This video is useless, you used a constant probability distribution assumption, which is not the REAL distribution for financial time series that is log-normal. In other words, that is not how you calculate the true VAR neither CVAR of a stock


Magnificent tutorial: you didn't get bogged down in the details of why cVaR is calculated in a certain, instead, choosing to explain the mechanics of how to compute it in a certain way. Well done dude.
sorry to be off topic but does anybody know of a way to get back into an Instagram account..?
I stupidly lost my login password. I would love any tricks you can give me
Sometime I don't know how to explain this things, and you make it look so easier, great video. Congrats.
PLEASE KEEP DOING THESE VIDEOS...WHO WOULD HAVE THOUGHT THAT CVAR CAN POEPLE EXCITED!
I never comment on youtube videos. But this was so well done, i couldnt not comment. THANK YOU.
SAME!...EASY EXPLANATION AND LOVED THE ANIMATIONS!
A very informative breakdown of VaR, and conparison to the value of CVaR. Thank you!
The method used for VaR is Basic historical simulation, a non-parametric approach!
he could've calculated Var(95%) = E(X) - St.Dev * (16.5 {corresponding value for 95% trust range})
Never seen this topic before, crystal clear, thank you!
Not gonna lie, you just saved my master’s thesis, thanks man!
Thanks for this video @QuentCourse. I have a question though. Am I okay to use lognormal returns for my calculations?
Thanks!
I've made a model to minimize risk in options strategies. (data from backtesting)
Nice video. Very informative. Thank you.
Nice video. Very fast compared to doing it by hand, so long as you understand the details in-between then all is good here. Nice refresher for single return without accounting for monetary weight.
An extremely helpful and informative video. Thank you
Hello! Great Video! How did you paste all the return formula down the column(2:25 in the video)? You clicked something(2:50), to drag the formula down the enitre column. How did you do that?
Hy u explained really well just have one suggestion can u zoom the image while u explain for clarification
He explains so clearly in all his videos. One can hear and see the confidence
A Very Great Piece.
Remember if that to (Renting) rates on option of opinion sensitively and consent, in consensus.
Accounting 🧾 : 2:58 1:48 2:03
well-explained, thank you so much!
Nice explanation.
Perfectly Explained. can you please also help me in calculating VAR through Delta normal method ?
nice explanation. please put a video on portfolio var
very useful & Simple methods of calculating cvar.Thanks for uploading
Accounting 🧾 : 2:58 1:48 2:03
Could you please explain how to calculate VaR for operational risk.
Great video, thanks
great video!!
Brilliant! Thanks for an excellent video! (Yes, I did learn something very important.)
Hi , What if i'm asked to calculate the n-day market risk VaR of the the bank stock for the a certain period at a certain confidence interval ?
Great question! If you are using daily returns, you can "scale" you VaR numbers by multiplying by the square root of time (VaR(95)*sqrt(n)). However, if you scale this for too long of a period, this has been shown to be quite an inaccurate assumption. Otherwise, you could use n-day returns and run VaR numbers on those returns. Or Monte-Carlo simulations!
use have to use square root rule of time and assume returns are IID. HS method cannot adjust to that as it makes no assumption about the shape of the distribution of the return curve.
Thank you for showing this. Could you extend the concept to the portfolio where there are multi-assets with correlation? The example you are given is based on the historical data (back forward-looking), can you share some method to be used for simulating the data in the future to do a forward-looking VAR calculation? Also, what are the kinds of VAR that big banks and asset management companies are using? Thanks!
Could you explain how to derive VaR from GARCH model & the use of ugarchroll in R
thanks for sharing. nice video. how about one on monte carlo simulation?
Hi. How it would be possible to calculate the VAR for a company which holds money in a bank account? It would make sense to assess the bank financial soundness, calculating the CAP ratio e than calculating the VAR for that company? what formula might be applied for this kind of calculation? thanks!
Nice video!
Is it possible to use a percentile rank to arrive at the same conclusion? Thanks!
If I'm understanding you correctly, that's exactly what CVAR and VAR involve. So yes - absolutely! PM me if you have any questions.
Awesome! I'm taking a risk management course and I'm trying to get a hang of the concept before we start working on projects.
Then you're going to love the next video we have in the pipeline... :-) Stay in touch!
As promised: quantbros.com/portfolio-single-stock-var-and-cvar-in-r/
What if you only have a sample of 20 data points. how would you calculate CVar then?
Amazing Video, Liked!
can i use this to calculate VAR of market risk?
Thank you for the video!
Can someone explain me the difference between CVAR (Expected Shortfall) and the Marginal Exspected Shortfall?
Hello! Is it possible to calculate the CVar with a span of a year or two and how can i change that in excel? I am working on a comparison between the results of the stresstest and the CVar for the european room on how they effect the systemic risk! Do you have some suggestions for me to make an adequat compariosn between those two units of measuring risks?
If I have a GARCH model that has a good VaR coverage (frequency of VaR exceedances) what does this mean? and how I can use such model to make returns?
cheers mate! its very helpful
Hello could you please explain how to calculate the Delta Conditional Value-at-Risk? ∆CoVaR
Hello, if the VaR(99.9) number is negative (e.g. -24922.8 in my case) what number do I have to choose from the Return column ?
Thank you, excellent video!
This is great! Thanks.
Hi, may I know what is the source of this and VaR and CVaR calculation? I meant like the books or journal. I want to use this as bibliography in my thesis. Thank you for your help and guidance. The formula is very helpful to me for calculate the VaR and CVaR of daily stock returns.
Hi, so i have weekly (7 days) of carry trade returns. I need to calculate the VaR for 5 days and one month with 99% and 95%. Any suggestions on how i can do that?
I need an example fo my course work: Calculating VaR and CVaR using monte carlo method. where can i find or buy ?
Use this method on a generated timeseries in R: quantbros.com/portfolio-single-stock-var-and-cvar-in-r/
We have other tutorials that involve monte-carlo simulations which could help:
quantbros.com/parallelized-simple-random-constrained-portfolio-generation/
I'm also currently working on a tutorials aimed at exactly what you're looking for, but it will most likely become a part of my course: www.QuantCourse.com
i cant understand how to use VaR or ES, so its very hard for me to make an example. how to start. can you help me? saying step by step what to do. its very important for me.
need the example in excel.
When using the VaR for to obtain Market Risk for Basel II, do i take the absolute value of VaR?
Just remember that VaR is an expected loss number. It depends on the context that you're using it in, but if you're adding this to your portfolio value, use a negative number.
If CVar is the same as ES then shouldn't CVaR be the average of the losses after the 320th returns?
hi, what is the definition of adj close ?
The adjusted closing price amends a stock's closing price to reflect that stock's value after accounting for any corporate actions. The closing price is the raw price, which is just the cash value of the last transacted price before the market closes.
Thank you for the video!! :) It's very helpful
I was wondering whether it is possible to apply VaR/CVaR to measure credit risk, because what you actually are measuring is market risk, right?
+Melié There are different models used in credit risk and market risk. In market risk, we mostly use VaR/CVaR and stress testing. In credit risk, we use models such as KMV, Altman's Z-score, O-score, Pr of default etc.. The key point is that in market risk, we try to model prices and returns. In credit risk, we model fluctuations in the value of assets, liabilities, cash flows etc.
+Mike Di Edwardo I'm very thankful for your answer. It has clarified my doubts. :)
THANKS MATE
Isn't this the correct formula for the returns Rt = (Pt - Pt-1)/Pt-1 instead of Rt = (Pt - Pt+1)/Pt+1 ? And the first return should be the undefined value, not the last one?
Still the video is helpful, thanks :)
Depends if the data is in reverse chronological order, which Yahoo Finance is notorious for doing :-)
Oh, okay. Makes sense :) Thanks!
Could you further elaborate how did you arrive at return values? here you have taken the YOY increase of the return, was it mere a reference as that is quite different to that of the return we actually calculate on stocks? Please help.
Entirely depends on the investment horizon.
Please elaborate.. Thanks.
What if you only have a sample of 20 data points. how would you calculate CVar then?
This is a non parametric VaR correct?
can someone link me the banger song at the start?
While you have pasted return values in D column and sorted it Ascending - at that time only column D is sorted. Not entire data is sorted.
really good
Love u sir
why were the returns sorted in ascending order?
I would say to account for the dispersion in a normal distribution, and to make it easier when using excel to calculate the probability of said negative outcome with the chosen confidence interval.
how can find risk if costumer give only give income and bank statement in auto loan
+Amit Raghuwanshi Not sure exactly what you're asking, but you would have to use a credit model.
thanks for the video, but you're calculating the VAR only based on history data. espacially in banking, there are much more ways how they're doing it. like a monte carlo simulation of the returns and based on that (expected value) they're calculating the VAR.
I think the historical way has caused partially the banking crisis. some szenarios are not included in historical data, so running stress tests or other simulations are helpful!
my thesis is about calculating VaR and CVaR and stress testing .. and i need help !
Give me ur Email and i will contact you .. if you can :)
CVaR is the Expected Shortfall
Correct!
Yes CVAR, ESF Expected short fall, Extreme value loss(derived from EVT - Extreme value theory) and other variants of computing ruin risk (UL -EL) are the same.
Hello,
Just one question. I understand the mechanic of the VaR and CVaR but why don't you use logarithms in the calcule of the returns?
Thank you
Log returns are actually different than discrete returns, but would probably work fine in this case since you're just looking at day to day returns.
How can you deduce the return of first day ? I think the formula will be [(B3-B2)/B2] rather than [(B2-B3)/B3]..
Don't think in terms of cells. Calculate the gain, and divide by the closing price of the previous day. Depends on how your cells are ordered.
Thank you Sir. My mistake. I did not look at the date
You offset the latest date when looking for the price delta.
Is this historical simulation, right?
Historical - not really a simulation at all. Simulated VaR is normally performed using Monte-Carlos and is forward looking.
Is that a Var function you used in excel? Its unclear.
But then you only have the max possible loss for 1 day. What if I want to look at longer periods of time?
Is it just me or did he do the % returns calculations wrong?
I know, right?
Apologies, disregard my question. You sorted the numbers, my bad.
you teach me way better than my idiot old professor.
is this correct? seems way too simple
So this is the historical method. What about variance and monte carlo methods? I guess they're all flawed so it doesn't really matter which.
It's funny how financiers try to make this seem so complicated.
Why you calculate me???
You're just a popular guy in the financial community, what can I say?
You wrong calculate the return
This is wrong at so many levels man. You're not taking into account either the standard deviation, the general return for the portfolio, the weighted composition or anything.
You're just saying an 'x' percentile will be your loss because... reasons.
VAR [95] 8.7
VAR [99] 1.74
VAR [99.99] 0.174
these are my number- I have taken 175 observations what will be the VAR @ 99.99% in this case - can anyone help?
This video is useless, you used a constant probability distribution assumption, which is not the REAL distribution for financial time series that is log-normal. In other words, that is not how you calculate the true VAR neither CVAR of a stock
obviously, he's using hostorical method in VaR and CVaR calculation, assuming a normal distribution