SPSS Diagrams - Histogram (via Chart Builder)

HTML-код
- Опубликовано: 22 окт 2016
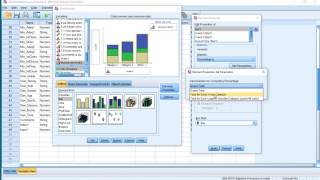
- Explanation on how to create a Histogram with SPSS using the Chart Builder. Also explained is how to show percentages, change the number of bins, and colors.
Companion website at PeterStatistics.com
Download the instructions shown in this video as pdf from userscloud.com/gqihc2rfl3v1


I cannot thank you enough. I was so stuck! You un-stuck me on how to change the intervals on my histogram! I feel like crying with relief. I would hug you if i could. 💞
Glad it helped! Good luck with your research/analysis/study.