SPSS: Creating Histogram using Chart Builder || Part 6 || Urdu | SPSS 25 || Dr. Sharqa Hashmi

HTML-код
- Опубликовано: 25 окт 2020
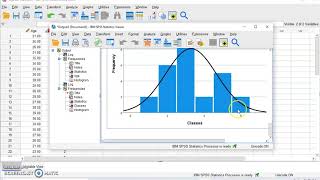
- Learn about the concept of Histogram. we will discuss two different ways of constructing histogram. How to define variables and construct Histogram in both methods. Also learn to edit the histogram in chart editor. If you found this video helpful subscribe and like this video, share it with your friends.
Thank you for watching the video. Feel free to leave any comments below!


Aysha Wajahat Siddiqi 78 section B BsCS Semester 2
Rafia Shaukat
Sem 2 BSCS
Hafiza Shamza Hanif
Section B
Present
Faseeha Khalid
Ghania Nasir
Eisha Zainab
Section B
BSCS (semester 2)
Laiba Rabbani
Section A
Bscs
Semester 2
Bushra Ashraf
7009
MSC chemistry 3rd
Aqsa Amin
Semester 2 section A
Nimra Amin section A
BSCS
Laiba asghar section b bscs 2 semester
Sehar Amir
Section B
Bscs semester 2
Rubiya Noor
Section B
Bscs Sem 2
106
Aiza Chaudhry(section b
2 semster
Sabooh haroon sec a
Bscs semester 2
Sawaira Nadeem
Section :A
Smester: 2nd
Roll no:113
Maryam
Section A
Amina Ahsan (7002) MSC chemistry III
Samra bukhari section a
Rimsha ch
Bscs
2 semester
Saniya Ismail roll no 111
Section A semester 2
Ayesha ijaz section A bscs
Roll no 77
Mamoona Zainab
Section A
Bscs semester 2
Roll no 98
Laiba Suhail
Section A roll no 93
Faiza Naseem MSc chem 7011
Amna iftikhar msc3. 7003
mam i have spss 23 but us me data veiw me wo variable k sath measure k signs show ni karraha hy
plzz mujhy is kaha bary me kch guade kardy
Fatima zafar
MSC chemistry
R#7013
Anamdowd 7004 msc chemistry
Mahnoor
Section A
Bscs semester 2
Roll nmbr 96
Hira Fatima satisfies (7015)
MSc chemistry semester 3 Areej Jhangir 7006
Maryam Bashir
Msc Chemistry (7026)
ayesha tehreem Roll no 7008 msc chemistry semester 3
949
Kibsa bashir
Roll # 7019
Arooj Fatima
SectionB
Rollno: 205110122
BSCS SEM 2
1655
Zoha wasif
Section A
Semester II
Roll no 2025110120
Bscs
Azka Bukhari 2025110079
Section A BSCS semester 1
iqra warasat 7017
Palwasha Muneeb Chemistry sem 3 roll#7028
Zaeema section A BSCS 2nd semester 2025110118
Maryam Bashir
Msc Chemistry (7026)
1688