Multiple Imputation in SPSS via OMS procedure: get a final single dataset!

HTML-код
- Опубликовано: 21 авг 2024
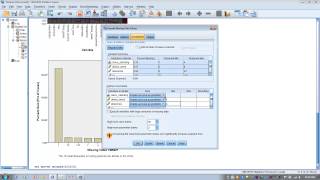
- A basic SPSS procedure after SPSS Multiple Imputation to compress the multiply imputed dataframe into a single one. Valid for scale or ordinal (categorical or nominal) variable types. Procedure is called "Bar Procedure".
IMPORTANT NOTICE: The procedure is working fine but the data displayed about the non-missing cases are incorrect. If you wish, repeat first the MI procedure and then apply my Bar procedure.
I really thank you DP viewer as he/she spotted the inconsitency. Appreciated!
Daniele  Спорт
Спорт


This has been incredibly helpful, and we'll certainly cite it in our paper. Thank you for your expertise, generosity, and the remarkable clarity with which you've demonstrated the procedure.
Thank you!!! This was incredibly helpful! You cured my dissertation headache!
great! happy for that.
I am writing my thesis. This video is so helpful. Thanks for your explanations. Best regards...
You saved my Thesis :) thank you
Exactly what I needed! I would have never found this option without this video...
glad to hear this : )
@@DB-in2mr I later found the option to aggregate data. How is it different from the method you show here?
Hi, please describe the option you found to aggregate data, so I can comprehend where the methods differ or not....
In the top menu "data" there is an option "aggregate data". And different options for aggregation (e.g. mean)
@@friedrichkopp5512 ok try if you get the same results by the procedure : ) ...in the version I was using at the time of this devs ...I think SPSS 26 (i do not recall exactly) it was not possible to aggregate anything on an imputed file as this one , and I think it is still like that.... but please give it a try yourself. INote: review from min 1 and check howI use mean and mode to aggregate values grouped/keyed by ID and imputation number in ascending order (that's key important) good luck : )
FROM THE AUTHOR:
IMPORTANT NOTICE: The procedure is working fine but the data displayed about the non-missing cases are incorrect. If you wish, repeat first the MI procedure and then apply my Bar procedure.
I really thank you DP viewer as he/she spotted the inconsitency. Appreciated!
Daniele
INCREDIBLY HELPFUL! Thank you!!
Thank you so much, this is EXACTLY what I needed!!!
happy to help
Thanks man! That was REALLY helpful!
Hello Daniele,
thank you for the video!
I first had the error code 4757 which I corrected by shortening the "width" of the ID variable, for example if you have ID_123 then the width should be 6.
Francesca
Francesca...I will get back shortly on this next week
so is your ID width shortening solved the issue then?
@@DB-in2mr Hi Daniele, yes I solved the issue this way and left this comment in case anyone else encounters this error code.
Excellent guide thank you!
Hello, thank you for the helpful video!
I was wondering, since I have a lot of variables and computing the frequencies seems to take forever, if I could also enter scales instead of each variable of the scale? Thanks for your help.
of course enter the scale as composite measure of a linear/non-linear (or weighted) composite score if you thinnk this is relevant. Note: at the end you just need one of the following measerment scale : numeric (ratio or scale) or categorical (nominal) or categorical (ordinal) ...this latter one with intrinsic dimension levels across levels of the category). Hope this may help.
Very helpful explanation :) Thank you!
Thanks Daniele! I hope to use this approach in handling missing data. However, I came across this paragraph in the book "Applied Missing Data Analysis" by Craig Enders (2nd Ed, p. 279): "Although it might seem reasonable to do so, averaging the imputations into a single data set is inappropriate, as is stacking the individual files and analyzing a single aggregated data set. Although the latter strategy could give unbiased point estimates in some cases, errors and confidence intervals would be wrong (van Buuren, 2012). Rather, the correct way forward is to perform one or more secondary analyses on each data set and combine multiple sets of estimates and standard errors into one package of results. Repeating an analysis 100 times sounds incredibly tedious, but most major software packages have built-in routines that automate this process."
Would you be able to provide any advice or guidance on this? Many thanks!
Hi @UTubeMeTock! ; ) I already replied several times in the thread about this.. : ) ..I can only say that you are 100% right. It just depends on what reference and objectives you have in your analitical framework (if you are investigating and rapid prototyping some measures with no differetial stats to do further, you the can certainly relax the standar error biases implicit in my procedure. If instead you need complete unbiased confidence intervals or standard errors you should avoid the the bar procedure...so it really depends!). As I said, in the past Rubin's great works (this should be you real reference ; ) as well as with van Buuren and may others I have their full point on this. Nevertheless, note thaty the variance of the same standard errors and the variance of the same confidence intervals can be monitored to check out two simple things: 1) is the difference between the classic (and unbiased) missing inputation methods and this "bar procedure" on standard errors and confidence intervals statistically significant? 2) if you perform both methods and you sopt a variation in standard errors estimates ...is this difference of any practical relevance to your activity of research? this is the same when you accept a type I error at .05 instead of .06 (this p value is the degree you accept that you can have a false positive ...a bias indeed : ))) MY SIMPLE SUGGESTION IS USE THE METHOD THAT FITS BETTER YOUR REASEARCGH KEY VALUE NOT A METHOD THAT IS MORE OR LESS BIASED : ) happyu stats man!
@@DB-in2mr Hi Daniele, thanks so much for replying! I sent you a message on Research Gate, it would be great to hear your further advice! Please let me know how else to contact you if there are other ways that would be more convenient!
Thanks for this. I was trying to find a work around to use my post-multiple imputation data set to run a moderation analysis using the process tool, a tool that seems to dislike multiple sets and does not produce a pooled result.
process by Hayes, cool!
YOU ARE MY SAVIOUR
no saviours here, just very normal people giving some support and suggestions : )
thank you so much for your video, I got one question. whether the ouput frequencies: ID number corresponds to the TableNumber in the aggregated dataset, since i need to combine the imputated data with other variables based on the ID, but there is no ID column in the aggregated data.
no harm to keep the ID column in the aggregation process. So you can have it availble as key feature to aggregate on your other features. let me know D.
@@DB-in2mr thank you for your reply, got it!
Thank you! Very useful and clear!
Hi Daniele, Is this essentially averaging the imputed data and then analyse? I was just wondering if there is a published reference journal for this method so we can reference in our manuscript? Currently, from what I did in the past is to analyse each dataset then SPPS will have a pooled estimate i.e., from T-test
Hey, the Bar procedure is suggesting to operate an average and median to scalars and categorical ordinals respectively, and impose a statistical mode on categorical nominal instances. Indeed your procedure is the most common and possibly standard way to pool MI values together. well done! my references here:
Baranzini, D. (2018). SPSS single dataframe aggregating SPSS multiply imputed split files. (Researchgate.net - doi:10.13140/rg.2.2.33750.70722). download here: www.researchgate.net/publication/328887514_SPSS_Single_dataframe_aggregating_SPSS_Multiply_Imputed_split_files
Also, I did not know but I was cited by these papers:
www.researchgate.net/publication/328887514_SPSS_Single_dataframe_aggregating_SPSS_Multiply_Imputed_split_files/citations
all the best
Daniele
Thank you for this. One question I had, why choose mode, or rather, why not also choose median? Is that not a bit more robust statistic considering we're going for aggregate?
Hi Hennie, yes for Var 1 and 2 (scale and categorical ordinal) you are right...so go with median if you wish, but not for Var 3 that is a nominal one and its categories don't have a meaningful order, obviously
Hello, thanks for the nice explanantion, would i be able to use the same way in order to calculate a poopled multiple regression analysis results after running MI ?
of course yes
Hi Daniele, as Melissa, I'd like to run a repeated measurement ANOVA in SPSS. You wrote, that you approach works for this analysis as well. Does the procedure described in the video used the pooled stats as described by Rubin (1987)?
Hi Julia, please take reference to Little & Rubin (2002) book "statistical analysis with missing data". read pp85 and 86...it is revealing.... : ) ...especiallty equation (5.17) : )
simple response:
I am applying a simplified procedure leading to (empirical) same results, in particular:
Technically,
Rubin imputes a final missing value by retaining both the within-kh sample variabliliy and the between-kh sample variabiliy. Instead, my procedure (Bar procedure) retains directly the between-kh sample vaiability in the estimates and nothing more.
In human terms:
I pool, make an average, of the multiply-imputed values directly as they are generated by the algorithm of choice (imputation byu EM, regression, etc).
So I average (with scale measures) o take the mode (with categorical ordinal or numerical measures) the imputed values and THEN I do the statistical anlaysis I need. INSTEAD LITTLE AND RUBIN REPEAT THE NEEDED STATISTICAL ANALYSIS N TIMES IN THE COMPLETED DATA SETS (THE N IMPUTED DATA SETS) AND THEN AVERAGE OUT THE FINAL ESTIMATE. CLEAR?
IF THIS IS NOT CLEAR I CAN SEND IN AN EXAMPLE TO CLARIFY, OK?
Nevertheless, check out what Generalised linear mixed models (for repeated measure desings) could do for small missing values analysis.
Thank you so much! Very helpful!!!
Would you use this to prepare a multiply imputed dataset for an rmANOVA in SPSS, or would you approach that differently?
Ciao Melissa, if you are referring to repeated measures ANOVA models (containing missing data) I would perform a General Linear MIXED model....so you do not need this procedure to pool multiply imputed datasets...
Nevertheless you could do both:
1) apply Multiple Imputation method (that is fit for repeated-mesures missing data as well),
2) apply the procedure I suggested here,
3) compare the results of 2) with the application of a General Linear MIXED effect model. This latter statistical procedure is ideal for treating repeated measures ANOVAS with misising data (but implies that you know how to perform mixed models, or Multi-Level-Models etc...)...if you need more assistance contact me via linked in for a simple chat.
Thank you very much for providing this video. I have a question for you. In the final aggregated dataset, the order of the data is based on "Table Number", does Table Number refer to the ID number? I checked the aggregated means against the original data and each imputed data. The aggregated mean of the data with no missing value should be the same, but the aggregated mean values are very different and I'm wondering if the sorting of the aggregated data is different from that of the original and the imputed ones?
first you are right! : ) ...the data about the imputed values presented in the clip I think it was from a corrupted file I used for the clip. But the procedure is working fine. If you repeat the MI procedure using the very first 6 rows (the original data with missing values) you will end up with the correct results. I really thank you as you spotted out the bug on the MI file. So please repeat the process with the original data to finalize the correct aggregation values. : ) PS I will put a notice for this clip and mention you for the spot checking. Appreciated ; )
Thank you very much, Daniele!
I followed the video and got the single dataset.
I wanted to check the validity of the bar procedure.
The problem is, when I compared the pooled results from SPSS paired samples t test to results from the new (single) dataset, I only got identical mean difference (e.g. I got different standard errors, t statistics and p values).
How would you recommend solving this issue?
your results are exactly what to expect.
as I already mentioned before (another reply), the bar procedure would capture ONLY the informational space of the parameter within group variability (e.g., the sd of a single parameter). You definitely loose the between-group parameter variability "portion" accounted for by the use of multiple repeated parameter esitmates: this is in fact the standard Rubin's rule (check this ResearchGate thread: www.researchgate.net/post/Is_is_valid_to_perform_aggregating_after_multiple_imputation). So I can certainly say that there is a certain bias in the bar procedure that is instead solved by the classic Rubin's procedure. Rubin = have n imputed datasets -> do the t test statistics n times, then average (pool) the n t test values. The standard errors and other parameters are pooled by using a little more than simple avergaing (the algorithms to compute standard errors are sometimes called Rubin's rules). The "bar procedure" basically gives more weight to the computational economy than precision statistics = have n imputed datasets -> AGGREGATE the vaues -> do a single statistic.
A possible first solution to reduce this bar procedure bias is to actually to boostrap the test of interest and check for consistency: if the bostrapping shows large variation then use Rubin, if not go for the bar procedure if you wish.
a second solution is more conservative: operate some sampling techniques and generate a between-groups MANOVA with IV (rubin vs bar procedure) and DVs t tests values, standard errors, averages etc... search for significant multivariate and univariate (roy-bargman step down) tests: if there is not substantial difference go for either procedures...
"no statistic is real or wrong, some are just relevant" D. Bar
Very helpful ! I have a question. I just followed this procedure to create a final imputated dataset for a few variables (food intake frequency). I want to do multiple linear regression with the newly imputated variables but all of my covariables are in my original dataset. Is there a way to combine the two ? I'm guessing copy paste won't work...
Hi Emma, copy past certainly can work out as well here ...but keep "covariate x subject" cell under control...that is,.... add the covariates as new columns in the processed/imputed dataset (but maintain variable by case coherence) .
All in all you, you end up with an imputed dataset (modified) with some appended covariates (original) into the same framework.
I get the error message ">Warning # 4761. Command name: SPLIT FILE
>The dataset cannot be analyzed as a multiple imputation dataset unless
>variable Imputation_ is defined as a SPLIT FILE variable."
I saw in the comments below that another person had this... and I believe that it showed up on your output as well and was wondering if it's okay to just proceed?
My SPSS also continues to shut down on the step of doing the frequencies...
do not worry about the error prompt 4761. Test that you get the results according to all steps in the procedure.
Thanks Daniele! What I didnt understand though is how do I match the final file that I get with the dataset?
hi! the first six original rows (at 00:02 for instance), in the second column ID is the column vector {A103, A104, A105, A215, A216, A218}. And the elements of this column vector are represented in the final dataframe at 05:53 with column vector {1, 2, 3, 4, 5, 6}, that is the first six rows in the first column called "TableNumber_" .
Simply, for instance, A105 = 3. Hope this is useful. : )
@@DB-in2mr Thanks. will go back to it tomorrow and hopefully solve it :)
Hello Dr. Baranzini,
I followed the video and got a single file in the end but it only contains all the descriptors of the values you removed at the end and no mean or modes of any values, are you familiar with this problem ?
it may be that the you missed out the step on calling for mean or mode...(check out 3.14 for instance). If this is not the case, try to redo the process step by step and let me know : )
Thanks a lot for this video, it is really good and clear. I have a problem though as I have more than 8 variables it does not split my file. How can I follow the procedure splitting a file with many variables, demographic and dependent, and 2 conditions? Even if I do only the dependent variables pre/post I have 10 (5 variables pre and post) and need to add a condition for further analysis repeated measures ANOVA. I also have tried splitting the file with less variables, even as little as in your example and the same error message comes up error 4757
Thanks a lot for your help
Ana
Ana, if you could send in a snapshot of the output with the error 4757 I can help better somehow - search me on LinkedIn in case.
@@DB-in2mr I realised the problem, thanks, but I cannot find anyone talking about the 'bar procedure' to include a reference in my paper, have you published anything about this? It will be great to add your reference if so. Thanks
@@goana747 a tech report pulished last year: www.researchgate.net/publication/328887514_SPSS_Single_dataframe_aggregating_SPSS_Multiply_Imputed_split_files
it is important that you understand that the Bar Procedure is really a procedure to manipulate data in the SPSS environment as SPSS does not have an easy/direct procedure for this type of action. (especially to what regards the pooling process for nominal variables : e.g., getting a MODE (the more represented category)...in fact most of the time you pool (average) numerical values , but sometimes you need to impute nominal values as well : )
Hi Daniele,
Thanks for posting this tutorial! I am having problems with the procedure though as I seem to get stuck at the split file by ID (cases) step. I get a warning in the output file that the data must be split by the Imputation variable. My original data consists of 14,211 participants and 5 imputed data sets. Is the bar procedure not suitable for a sample size this big?
Once I successfully aggregate my imputed data into one file, I actually wish to merge that into my time dependent Cox regression data set with almost 12 million records. Would that be possible?
Hope you can answer my question! Thanks in advance!
at 2:19 of my clip: is that the warning you are talking about? if that so, you may want to override that warning in the output. BEST thing you could do is to send in on to me a snapshot of your steps here or by email if you wish. Volume of data is not the issue.
@@DB-in2mr Hi Daniele. Thank you so much for this video. When I use a smaller file of 10 cases, I pool the data in a single data set without any issue, but when I use a larger data set of 1,834 cases, I can't get the data in a single data set (Only 3 columns do appear in the pooled data set: Table command, subcommand and label with no data in any of the columns ). I can also recall that the split error message mentioned in your clip at 2.19 equally appears when dealing both with the smaller file as well as with the larger one. How best can you help? Thank you in advance. Dove
@@dovedjossaya6331 please verify your memory size limits in SPSS. And increment the cache limit in case (e.g, go to syntax, enter show workspace ....and then ....set workspace = 100000) - clip here in case: ruclips.net/video/6vK-WZaqZ_8/видео.html at 2.19 the error prompt will remain there, but diregard it ....
Hello @@DB-in2mr . I tried increasing the workspace to 500,000 but I got the following error message: "Processor is not available". Just to recall that I'm using spss v20.
@@dovedjossaya6331 scale down from 500000 untill you find the right fit size. Nevertheless, v20? we are over v29 : )
Thank you so much for your video! However, I have run into an issue where when my new aggregated file is created all my participants are pooled into one row! So I have all my variables but all in one row when I am supposed to have 188 rows.... I have followed all the steps carefully and can't see when I could have gone wrong... please could you help
did you split by ID ? (see 2:35)
@@DB-in2mr yes I did, however my ID has 4 digits.. do you think that may have had an impact on the process?
@@angelinedove6324 ....go at 01:14 mins in the clip...I have imputations 1,2,3,4,5 (first column) ordered and the second column my ID "A103" repeated 5 times as the number of imputations...do you have the same structure?, if you do not have the same structure there you have a problem at this point. The ID four digits should not be a problem, but you should have the same ID value repeated n. imputations like mine at 01:14 mins.
@@DB-in2mr Yes, everything is the same, I have 5 imputations for each ID everything looks exactly like yours but the new pooled datasheet only shows one row (all participants are compressed to one row). I am puzzled as to why it did this...
@@angelinedove6324 : ) at 02:40 I split file with ID...check this step...also check out that you closed the OMS procedure at 03:30...(with end all tab activated)...if any of this works out...let me know. ...PS I think I was on the SPSS versio 25 or 26....what version you are in?
Thanks for your video, I'm about to use this technique for some project work. How valid is any further analysis (clustering, forecasting, etc) from the pooled dataset? Is it more or less representative than combining analysis from 5 imputed sets at a later stage?
Very good question and approach: I call it equifinality…
The two procedures are expected to generate between models covariance ratios approximating pearson corr. ~.80+.
Let me explain:
A) …if you do ensemble modelling (either homogeneous or heterogeneous) by application of cluster analysis + SVM + kNN + Logistic regression,…etc, then correlate the averaged prediction of this ensemble model with the prediction values derived by my “Bar procedure”: You should expect person ~.80+ .
a. If you reach this correlation value, then the effects of the pooling performance is minimal: maybe choose the model (or models) that are developed more efficiently….
b. If a small correlation is detected, you would test which model (with its specific pooling mechanism) to retain based on best model Fit (compare best confusion matrix results, R2, adjusted R2, AICC, F ratio, AUC, Gini index, etc…)
B) If you, more simply, are applying one algorithm (e.g, LASSO regression or quantile regression or standard OLS, or COX..etc) repeated per each imputed data-frame, then compare again correlations (or covariances) across these same-algorithm generated models and the one generated by the “Bar Procedure” I devised…
Overall, run both procedures, compare them and test them on fit criteria. The risk of your procedure (use single imputed data sets and then aggregate) is to increase uncertainty over multiple parameters repeatedly redesigned across models. That may be complex to understand. The risk of my Bar Procedure is shrink this cross models variability and rely too much on standard approach
Hope this help
Any methods paper citation for this approach?
Hi Nihil
citations for this
Baranzini, D. (2018). SPSS single dataframe aggregating SPSS multiply imputed split files. (Researchgate.net - doi:10.13140/rg.2.2.33750.70722). download here: www.researchgate.net/publication/328887514_SPSS_Single_dataframe_aggregating_SPSS_Multiply_Imputed_split_files
here below:
Cited by these papers:
www.researchgate.net/publication/328887514_SPSS_Single_dataframe_aggregating_SPSS_Multiply_Imputed_split_files/citations
all the best
Daniele
@@DB-in2mr Is this a peer reviewed publication? Do you have evidence (analytic or Monte Carlo simulation) that this works given different missing data mechanisms (MCAR, MAR)? From my reading of the literature the goal of multiple imputation, from the perspective of Rubin is not to generate a single data set for analysis but to fit the model of interest on m, say 20, imputed data sets and then summarize the point estimates and standard errors. Am I missing something?
@@nihilfit4537 please have a read on the varius threads below (my responses to your issues to other people here below)...I explained several times the point of this procedure and differences with Rubin (a standard ...of many standards though). I remember I did some sensitivity analysis and comparisons in the past between bar procedure (this one) and rubin (standard approach)...they were approximating same results with normally distributed variables and iid conditions respected in full....but it was experimental. Ideally,... some monte carlo would do...Actually, I would be your fan if you would give it a try yourself and test on multiple samples the cross-generalisation performance amongs the two procedures.
One thing for all (and maybe your single missing point here) : I created this procedure (some years ago now!) to circumvent the fact that SPSS was not simplly allowing to combine the dataframes in MI easily. It was a development less concerned about issues on Rubin procedure, MCAR, MAR and full non-MAR (the real monster issue for statistical and model -based imputation pricedures).
In this view all Rubin caveats (an warnings I suppose) on pooling multiple imputed dataset and then a single estimation of parameters instead of multiple estimations of params (for each imputed dataset) and THEN the pooling procedure (the actual Rubin) apply here (and I partly agree on these).
Nevertheless, I think AI and Machine Learning (my fields) is giving other more powerful standards for missingness. So if you even fancy a jump into the AI area (not for missingness though) then read my last paper on Nature journal (IF 9):
www.linkedin.com/in/danielebaranzini/recent-activity/shares/
Best,
Daniele
Thank you so much - I think this might simplify my phd headache as well.
Is this method equivalent to a pooling procedure, though, as SPSS normally doesn't provide pooling for rmANOVA and do you by any chance happen to have a source at hand which says that your OMS approach is a way to conduct a rmANOVA after MI in SPSS?
As I have nested data and 3 measurement points I'm also thinking about going for a multilevel model but as I've never done it before it might be better to stick with rmANOVA, don't you think?
The only thing is that I'd have to use the missing dataset for all the other descriptive (sociodemografics, scale-analysis) etc. (correlations, baseline t-Test...) analysis with changing sample size respectively... Would you consider this as much of a problem? Your piece of advice would be highly appreciated!
pooling procedure: yes, not the same but equivalent (read carefullly my reply to Julia Schmid about similarity with pooling by Little and Rubin (2002)).... is the OMS approach a way to conduct a rmANOVA after MI? well, Tabachnich and Fidell (hope you know who they are : ) reported that MI is ok longitudinal applications: rm techniques (e.g. ANOVA) is one of them. So indirectly the imputation of values is protected and the Bar Procedure goes along well with it : ) YOU HAVE TO GO TO MULTILEVEL MODELING NOW : ) so I think you have to be brave and just search for Mike Crowson tutorial in You Tube about it - Finally read this tech note of mine about Bar Procedure www.researchgate.net/publication/328887514_SPSS_Single_dataframe_aggregating_SPSS_Multiply_Imputed_split_files
The only thing is that I'd have to use the missing dataset for all the other descriptive (sociodemografics, scale-analysis) etc. (correlations, baseline t-Test...) analysis with changing sample size respectively... Would you consider this as much of a problem? Your piece of advice would be highly appreciated!
if you have more than 5-10% missing on such demographic variables you shoud apply SPSS MVA method in order to verify if you are in MCAR CAR nMAR ...then consider to impute those demographics if relevant to your further research
The text and contents can't be seen.
Najeebullah whai is it that you cannot see? none before had this issue : )
Thank you very much for this video!
I have an issue. I got this error:
>Warning # 4761. Command name: SPLIT FILE
>The dataset cannot be analyzed as a multiple imputation dataset unless variable Imputation_ is defined as a SPLIT FILE variable.
I have 20 imputed datasets, and 2400 cases for each dataset. Could you please help me solve this problem?
Thank you for this, can this procedure used for continuous variable? thank you
yes Hiziani, this procedure is used for continuous variables. hope this helps.
Thank you so much for this video, this is exactly what I was searching for. I have one issue, maybe you can help? After putting the common into OMS, splitting the file by ID, I want to look at the descriptive statistics, the frequencies. I chose mean and mode in the menu, and when I click ok, my spss program shuts down. I have tried it now several times, I am never able to get past that point (3:25 in your video). Did this ever happen to you or someone else? Any suggestion on what it could be or how to take care of it? Thanks in advance :-)
Hi Venera let me check out on this and be back to you...ps - what is the spss version you're on?
@@DB-in2mr Hi! :-) I am working with version 28. Thank you so much. I really don't know what it could be...
@@veneragashaj1278 Very sorry I am late on this but I tested version 28 and apparently it works perfectly. My suggestion is to repeat the procedure step-by-step. Daniele
Thanks!
Thank you very much for this video!
I do have an issue, I got this error:
>Error # 4757. Command name: SPLIT FILE
>No more than 8 split file variables may be used by the SPLIT FILE command.
>Note that long string variables account for multiple split file variables.
>Execution of this command stops.
I have 20 imputed datasets, and 6 imputed variables, could you please help me solve this problem?
apparently you are using more than 8 split file variables? if so, apparently spss cannot parse the spilt...simply check out how many variables you put in the split file procedure (see min 2:40)...tell me how many variables your're entering there...you should have CODE ID variable only (so a single split file variable)
@@DB-in2mr I have realized I entered more variables than I should, so I just completed the analysis with 6 imputed variables but then I got another issue, very weirdly, the ID variable's width was 256 somehow, and I changed it to 64 in the variable view, now everything worked out great! Thank you again!!!
Hi, is there a paper that I can reference this procedure (for my thesis)?
here you go: www.researchgate.net/publication/328887514_SPSS_Single_dataframe_aggregating_SPSS_Multiply_Imputed_split_files
@@DB-in2mr Thank you for this. Are there also any journal article that support the logic of the procedure?
For example, Little and Rubin (2002)?
@@brac5933 if you are referring to pool the multiply imputed values in SPSS as the "Bar procedure" there is a single paper published some times ago referring to its use:
(www.researchgate.net/publication/342022230_WEARCON_Wearable_home_monitoring_in_children_with_asthma_reveals_a_strong_association_with_hospital_based_assessment_of_asthma_control )...
I do not know any other quotes on it. Nevertheless I urge you to read the previous thread here by Julia Schmid
and my reply to her...and note that even if there are some similarities with standard Rubin's Rule for standard statistical MI pooling, I consider the "Bar procedure" a simiplification of Rubin's method that gives more efficiency but could have more intrinsic bias in the final estimates.
@@brac5933 Yes, in Little and Rubin (2002) read anyway pp 85 and 86 of that book and equation 5.17, 5.18, 5.19 and 5.20. They perform a required statistics REPEATED over n number of imputed datsets and AFTER THAT they apply the equations for pooling a final estimate. My procedure instead will pool (average) directly the imputed values in the n imputed datsets and AFTER THAT perform a required statistics only once!. I basically do not apply the Rubin's rule...I reduce it relaxing the statistical issue of within and between imputation variances. be sure to discuss this with your supervisor : ).
hi, how to make sure we dont lost track the data with the ID?
Hi ...simple. Go to clip at 3.00min where I open the instruction for Frequencies ...select the ID feature and put it together with the other three ones. That's it!... When you will finilaze the new dataframe (watch from 3.52min), the ID feature can be retained as per "mode"... (basically you're forcing to do a mode on the ID feature : ) )
@@DB-in2mr Hello, my IDs are all in this form: R_qQ2FL19q95GwWXf and when I run mode on this, the ID does not appear. I'm not sure mode works on strings. Is there another way we can get ID to appear?
Hi @@simonchan2394 let me verify this. I will be back soon
@@simonchan2394 mode can work on strings as well apply tyhis SPSS syntax
AGGREGATE
/OUTFILE=* MODE=ADDVARIABLES
/BREAK=strvar
/strvar_freq = N.
EXECUTE.
SORT CASES BY strvar_freq(D).
not sure why you get that type of IDs ... what SPSS version you are in?
Daniele