1000 normal QQ plots in 30 minutes (n = 25, sampling from N(10,5^2))

HTML-код
- Опубликовано: 1 окт 2024
- Title, essentially.
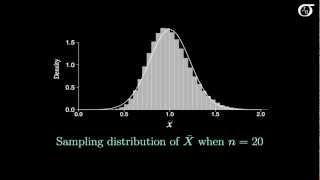
Properly interpreting normal QQ plots takes some experience, and part of that experience is developing a feel for what natural variability looks like on a normal QQ plot (when sampling from a normal distribution).
Each of these 1000 plots is based on a sample of size 25 from a normal distribution with a mean of 10 and standard deviation of 5. Created with R’s qqnorm and qqline.
Which one is your favourite? Mine are 225, 245, 314, and 330. I’m (kinda) joking. Or not.
Looking for more info about normal QQ plots? I have a full video description of them here:
• Normal Quantile-Quanti...
I’ll try to get back to making real videos, folks. But I think this one is useful and I have places I'd like to use it.


![Cody Johnson - I'm Gonna Love You (with Carrie Underwood) [Official Music Video]](http://i.ytimg.com/vi/yy9PuYMU29g/mqdefault.jpg)


Looks pretty normal to me
I used this channel so much when I was learning/teaching statistics. I'm glad that you're back and thanks for all the work.
update from JBStats????
I was planning on a more exciting comeback, but this will have to do for now :)
She QQ on my plots till I
should I subscribe to this channel? Let me know guys !
We want you back!
I'll find my way back :)
hey, long time!
Indeed! Thanks for noticing :)
welcome back sir