Thank you very much for your videos and the knowledge shared in your channel. Very interesting and informative. Please can you do a video about Genome Wide Association Study (GWAS) and microbial GWAS ? Will be very interesting and help full for most of the scientists working in genetics to understand this analysis and be able to perform it. Will be more help full to get a tutorial with sources of codes. One more time thank you very much.
Hello! I encountered a problem with the analysis using the voom() code as it promote Error in voom(d0, mm, plot = T) : NA counts not allowed. I already triple checked my expression data and there are no NAs. What could be causing the error?
I like your theme of R Studio, its look similar to VSC of python. . .can you tell me how can you merge console and working window of R? I am interested in it
Have you tried using markdown files? That is what is being used here and you have a lot of options about whether the code, output or errors are printed etc.
this is a very nice vedio. I need to analyze my gene expression data by WGCNA but unfortunately i feel problem for analysing through it.Can you please give me some suggesstion on that.Thanks in advance
My usual method of analysis involved replicating the script from the documentation I can find, then substitute in my own dataset to ensure it could run. This could involved reformatting my dataset to fit to the dataset from the official script. Then only I try to reverse engineer how I can make the analysis to work with my script. This will involved the understanding of the functions one by one.

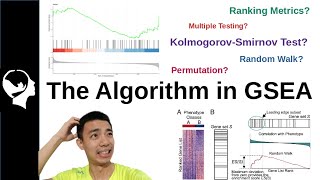


2:30 Chapter 1- Understanding of data
6:50 Chapter 2 - Data Normalization and Transformation
9:35 Chapter 3- isolating DEGs
Nice one
Thank you very much for your videos and the knowledge shared in your channel. Very interesting and informative.
Please can you do a video about Genome Wide Association Study (GWAS) and microbial GWAS ? Will be very interesting and help full for most of the scientists working in genetics to understand this analysis and be able to perform it. Will be more help full to get a tutorial with sources of codes. One more time thank you very much.
interesting, let me have a look at that
Hi! is it possible to use this pipeline for proteomics analysis?
thank you
please a need to install limma i need help to
Hello! I encountered a problem with the analysis using the voom() code as it promote Error in voom(d0, mm, plot = T) : NA counts not allowed. I already triple checked my expression data and there are no NAs. What could be causing the error?
Hmm, that's a complicated case to diagnose. Can you sent me a csv of your data?
Hello!
Could you explain setting the cutoff point in a different dataset?
Hi Victoria, is it ok if you let us know what time point is that being applied?
Now I don't understand how to divide the groups
I like your theme of R Studio, its look similar to VSC of python. . .can you tell me how can you merge console and working window of R? I am interested in it
Have you tried using markdown files? That is what is being used here and you have a lot of options about whether the code, output or errors are printed etc.
Please kindly sugges channel like you for python for bioinformatics
I can only think of the data professor off my head, but I will add on to this thread if I remember any
@@LiquidBrain thank you
this is a very nice vedio. I need to analyze my gene expression data by WGCNA but unfortunately i feel problem for analysing through it.Can you please give me some suggesstion on that.Thanks in advance
My usual method of analysis involved replicating the script from the documentation I can find, then substitute in my own dataset to ensure it could run. This could involved reformatting my dataset to fit to the dataset from the official script.
Then only I try to reverse engineer how I can make the analysis to work with my script. This will involved the understanding of the functions one by one.
@@LiquidBrain Thats great idea,but it is very nice of you ,if gave me some of instruction about that
poor pedagogic skills
extremely poor explaing skills. There is no point to rush sacrifying the sake of clarity. Disappoiting