you saved me dear. if i did not find this video i would quit my Ph.D. i am working in R and my experiments are also based on frequencies and their effect on the tone of the word. this solved my problem. i have no words to say thanks to you.
Really great video! I think regularized regression techniques are outside of GLMs. Generalized linear models have a somewhat rigid statistical definition that is based on the form of the exponential family. Binomial regression, poisson regression, beta regression, gamma regression, etc. are all exponential family, which allows us to develop a GLM regression from those distributions. Regularization involves adding a penalty term that penalizes large coefficients, which does not match the exponential family distributional form. Regularization is a machine learning technique that starts to move away of traditional statistical techniques. At least, this is my understanding of how those ideas fit together!
Important to distinguish between General Linear Models and Generalized Linear Models too! Stats terminology and Machine learning terminology can be quite annoying to navigate
Hi, very useful and clear, thanks! When you have several fixed factors (e.g. 4 fixed factors), how do you set the null model to test the anova? Should you remove predictors one by one? Run anovas one by one with each null model with -1 predictor?
Thank you for creating this video!! So easy to understand the LMM model. Just one question, how did you set your screen so that it shows the script and output all in one screen? That looks so intuitive and easy to look at!!! Thank you for your help!!!
A quadratic model is a linear model, (look up polynomial regression). Linear doesn't mean line, it means the model can be expressed as a linear combination of weights and variables. Transforming the predictor variables does not make it non-linear because the model is Y given X so the predictors are always assumed to be fixed. If the coefficient has a square though then that is non-linear.
Thank you for this video! Your explanation of running the models in R is very intuitive. When writing up your model results, do you ever report statistical significance of your fixed effects? I tried publishing by comparing model fit alone and got strong push-back from reviewers. Thanks!
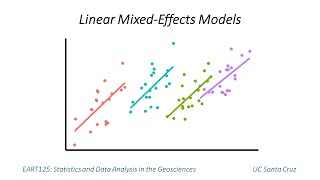
I suppose you can extract the individual intercepts from the model and plot them individually on the plot, similar to those plots in 17:57 . But I don't think there's a way to do it without a custom functions. Might need to code it for the data.
Thank you for the tutorial - how do you handle zeros in the dependant variable? And do you add a independent|id on the random effect for each independant variable you add on the fixed side of the equation?
Do you mean zeros in data, or missing data in general? For 0 that is causig error I suppose you could just add 1 to all data , and for missing I just uploaded a video on imputation for raw data :) . I am not too sure what you mean for the independent|Id questions though, do you mean should each random effect be specific each?
Secondly, you mentioned somewhere that if one of the explanatory variables is a factor or categorical, we use generalized linear function not linear. I suppose lmer is also linear but with random variables. Can you please elaborate why you used lmer when yiu had attitude as factor.
I believe there isn't always a correct answer to which model to use on which analysis, glm might be a better fit for the data, but might also resulted in over fitting. So, a linear model was used here to illustrate this example.
As someone who teaches MLM to students, I appreciated your systematic and sequential approach to explaining this complicated approach. However, as someone with a hearing disability I found the background music distracting and it masked my ability to hear your speech at times. Respectful suggestion: just do without the music and let us listen to you without distraction.
i'm no expert but when you discuss linear model with multiple x (slide with the hyperplane) isn't that the General Linear Model but when you discuss ridge regression and such isn''t that Generalized Linear Modeling?
Dear brother, how to determine whether random effect variables or fixed effect variables because in my case, I had a lot of variables in my topic? thanks for your answer
Amazing video! And I have a question that how can we control a confounding factor which is not our interest but do influence the dependent variable in the lmm model? thx
Ya, that's a hard question. The easiest way might be a better experiment design? Otherwise might be depending if you have enough samples to allow you select different groups that allow the factor to be normalized in the comparison.
@@AqleemAbbas Same! My lab has been studying swine microbiome, but we have built a few models that you can look at and apply to your own data (Microbial composition differs between production systems and is associated with growth performance and carcass quality in pigs). Christian Maltecca is the first author. Go through some of his published microbiome papers if you want to see how he built microbiome into classical genetic models. Remember, its crucial to determine the factors (fixed and random) that play a role in your data.
Hi, thanks for the video, what if I want to post hoc compare following the mixed effect model, like comparing is there a significant difference between the Female vs Male effect on frequency? how to do it in lme4?
I am not too sure how to actually do such analysis in this context, do you mean which gender would have a bigger impact on the frequency? you can tell that from looking at the intercepts and the gradient of the linear model~ :) -Brandon
Hi, awsome video! How would you approach a slightly more complex model, with more fixed effects and their interactions? How one approaches random slopes in that case? Here you only focus on 1 effect in your research question/model and the rest is only accounting for what we know about the data (scenarios/sex etc.). But what if I have 2 or 3 fixed effects and I'm interested in their interaction? How would you write a code for random slope of subject in that case? Do I need that for all fixed effects separately?
Hi, this is a great video! Can someone help me understand why frequency is the independent variable here? If you are measuring frequency based on scenarios with different politeness, aren't you manipulating the scenarios, meaning scenario would be the independent variable and frequency the dependent variable? Maybe I'm just missing something here, any help would be appreciated! :)
Not sure if I am saying it wrongly in the video, but you are correct that frequency is the dependent variable here: For example; pitch ~ politeness + sex + (1|subject) + ε this equation model the concepts on how politeness, sex in different subject affect the final pitch(frequency), so perhaps the sex can be understand as the independent and the pitch as the dependent; the other could be the controlled variable in this experiment.
For NA it really depends on the source of the data, In this example there are removed to simplified the process. For data imputation, you will need to understand the nature of those errors. Some data, for example, environmental temperature might be able to use a simple moving average for its imputation, but for drug interactions, it might be easier to just remove the sample if you have enough data.
Hi, this is really helpful, thanks! I'm trying to watch as many linear mixed model videos as possible to understand the background. If you have time, can I ask, why do you use 1+ attitude/subject and 1+ attitude/scenario, but not 1+gender/subject and 1+gender/scenario, is this because you don't expect slope to change with gender? If so, do you happen to know what equation I would use if I did expect slope to change with gender? To model bat_body_temp. I currently have two fixed effects (ambient_temp and fed_notFed and one random effect individual _bat, just trying to work out what the best equation to use is if I want to assume that the slope might vary for the different individual bats).... thanks!!
There is actually a lot more background from the study I didn't mange to put into the video, you can refer to the intention of the author here: bodowinter.com/tutorial/bw_LME_tutorial2.pdf I am not exactly sure about the bat situation, but if you set individual bats as your random variable, would it hurts your statistical power since you only have 1 data point per bat? or are you working with longitudinal data in your study? equation: bat_body_temp ~ gender + ambient_temp + fed_notFed + (1|individual _bat)
@@LiquidBrain thanks very much for the reply, I'll have a look. I have several (~6 or 7) bat_body_temp points per bat for various different ambient temperatures and for both fed/not_fed conditions. I don't actually have male and female bats they were all male, just was wondering hypothetically about the equation. I think if I read more I will understand. Need some spare time to work on it!! Thanks again :)
To oversimplified a bit, Linear = a line, or line like stuff Regression = trying to fit a model into a data correlation= does the two dataset looks similar to each other


![Felix "Unfair" | [Stray Kids : SKZ-PLAYER]](http://i.ytimg.com/vi/Oswujxm2Ag0/mqdefault.jpg)


you saved me dear. if i did not find this video i would quit my Ph.D. i am working in R and my experiments are also based on frequencies and their effect on the tone of the word. this solved my problem. i have no words to say thanks to you.
I've never learned stats so easily, thank you so much for making this video!
Most clear and concise lmem summary I've seen, showing the syntax makes it so clear to do it on r, no other videos I've seen do this
So great content! Thank you a lot. No one had ever explained LM to me in such a simple way before.
The video is of great use! Can't wait to watch more videos concerning R studio🥰
insanely helpful, very clear explanation and workshop!
Thank you so much for your video! It really helped me during my master thesis. All the best for you :)
You saved me and my time. This video is beneficial. Thanks.
You made my life easier with this explanation! Thank you so much.
Well...never thought a fellow 9gager would one day teach me LMM...thanks op
thank you so much for this intro! one of the best explanations I’ve come across!`
Thank you for the video. It helped me a lot.
Super useful, super clear. Thank you so much 😁
(1 | random1) means that it is going to calculate a separate intercept for each one of the categories in "random1"
such a clear video! thank you!
Really great video! I think regularized regression techniques are outside of GLMs. Generalized linear models have a somewhat rigid statistical definition that is based on the form of the exponential family. Binomial regression, poisson regression, beta regression, gamma regression, etc. are all exponential family, which allows us to develop a GLM regression from those distributions. Regularization involves adding a penalty term that penalizes large coefficients, which does not match the exponential family distributional form. Regularization is a machine learning technique that starts to move away of traditional statistical techniques. At least, this is my understanding of how those ideas fit together!
Important to distinguish between General Linear Models and Generalized Linear Models too! Stats terminology and Machine learning terminology can be quite annoying to navigate
Thank you very much! You helped me a lot! :)
THANK
YOU
!!!!!!!!!!!!!!
ICONIC
Very good content !
Thank you so much for sharing this, it was an interesting piece of work.
Hi, very useful and clear, thanks! When you have several fixed factors (e.g. 4 fixed factors), how do you set the null model to test the anova? Should you remove predictors one by one? Run anovas one by one with each null model with -1 predictor?
Very good! Thank you for that!!
Thank you for creating this video!! So easy to understand the LMM model. Just one question, how did you set your screen so that it shows the script and output all in one screen? That looks so intuitive and easy to look at!!! Thank you for your help!!!
I noticed that too! And it seems he doesn't use R script, but R notebook format :) I'll definitely start using that!
A quadratic model is a linear model, (look up polynomial regression). Linear doesn't mean line, it means the model can be expressed as a linear combination of weights and variables. Transforming the predictor variables does not make it non-linear because the model is Y given X so the predictors are always assumed to be fixed. If the coefficient has a square though then that is non-linear.
Thank you so much Sir for helpful tutorial. Could you show us how can we visualize mixed effect model with more than 1 predictors in R Please ?
Thank you for this video! Your explanation of running the models in R is very intuitive. When writing up your model results, do you ever report statistical significance of your fixed effects? I tried publishing by comparing model fit alone and got strong push-back from reviewers. Thanks!
Interesting !
Thank you! This is great! Do you have any videos on how to plot (or visualize) results of Linear mixed models??
I suppose you can extract the individual intercepts from the model and plot them individually on the plot, similar to those plots in 17:57 . But I don't think there's a way to do it without a custom functions. Might need to code it for the data.
Great lecture.
At 8.01, why will it be a problem to define race as 0,1,2,3? Please explain.
Thank you for the tutorial - how do you handle zeros in the dependant variable? And do you add a independent|id on the random effect for each independant variable you add on the fixed side of the equation?
Do you mean zeros in data, or missing data in general? For 0 that is causig error I suppose you could just add 1 to all data , and for missing I just uploaded a video on imputation for raw data :) . I am not too sure what you mean for the independent|Id questions though, do you mean should each random effect be specific each?
Can I compare more than 2 scenarios (more than just formal, informal, etc..) with LLM?
I want to join the membership here but seems like it's not possible, please advise
I think you might have to check with RUclips in your country perhaps its not supported there
Secondly, you mentioned somewhere that if one of the explanatory variables is a factor or categorical, we use generalized linear function not linear. I suppose lmer is also linear but with random variables. Can you please elaborate why you used lmer when yiu had attitude as factor.
I believe there isn't always a correct answer to which model to use on which analysis, glm might be a better fit for the data, but might also resulted in over fitting. So, a linear model was used here to illustrate this example.
As someone who teaches MLM to students, I appreciated your systematic and sequential approach to explaining this complicated approach. However, as someone with a hearing disability I found the background music distracting and it masked my ability to hear your speech at times. Respectful suggestion: just do without the music and let us listen to you without distraction.
i'm no expert but when you discuss linear model with multiple x (slide with the hyperplane) isn't that the General Linear Model but when you discuss ridge regression and such isn''t that Generalized Linear Modeling?
Dear brother, how to determine whether random effect variables or fixed effect variables because in my case, I had a lot of variables in my topic? thanks for your answer
why gender is not entered as random slope for the two random intercept
I want to know more about how to calculate 95%CI and odd ratio for the linear mixed model in R.
Amazing video! And I have a question that how can we control a confounding factor which is not our interest but do influence the dependent variable in the lmm model? thx
Ya, that's a hard question. The easiest way might be a better experiment design? Otherwise might be depending if you have enough samples to allow you select different groups that allow the factor to be normalized in the comparison.
I think it is generalized linear model, not general linear model
THANK YOU
How can I use these models in plant diseases
Well, it depends on the raw data, what's the dataset you are dealing with now?
@@LiquidBrain I am dealing with microbiome
@@AqleemAbbas Same! My lab has been studying swine microbiome, but we have built a few models that you can look at and apply to your own data (Microbial composition differs between production systems and is associated with growth performance and carcass quality in pigs). Christian Maltecca is the first author. Go through some of his published microbiome papers if you want to see how he built microbiome into classical genetic models. Remember, its crucial to determine the factors (fixed and random) that play a role in your data.
@@Jonathan-sz8wj Great Sir
Hi, thanks for the video, what if I want to post hoc compare following the mixed effect model, like comparing is there a significant difference between the Female vs Male effect on frequency? how to do it in lme4?
I am not too sure how to actually do such analysis in this context, do you mean which gender would have a bigger impact on the frequency? you can tell that from looking at the intercepts and the gradient of the linear model~ :)
-Brandon
I want to know the name of dark theme you used in R
It's Tomorrow Night Bright 😎
What’s the name of the song
Are linear mixed model same as random parameter models?
Sorry not super familiar with random parameter models, perhaps other view can help to answer this question
Hi, awsome video! How would you approach a slightly more complex model, with more fixed effects and their interactions? How one approaches random slopes in that case? Here you only focus on 1 effect in your research question/model and the rest is only accounting for what we know about the data (scenarios/sex etc.). But what if I have 2 or 3 fixed effects and I'm interested in their interaction? How would you write a code for random slope of subject in that case? Do I need that for all fixed effects separately?
Hi, this is a great video! Can someone help me understand why frequency is the independent variable here? If you are measuring frequency based on scenarios with different politeness, aren't you manipulating the scenarios, meaning scenario would be the independent variable and frequency the dependent variable? Maybe I'm just missing something here, any help would be appreciated! :)
Not sure if I am saying it wrongly in the video, but you are correct that frequency is the dependent variable here:
For example;
pitch ~ politeness + sex + (1|subject) + ε
this equation model the concepts on how politeness, sex in different subject affect the final pitch(frequency), so perhaps the sex can be understand as the independent and the pitch as the dependent; the other could be the controlled variable in this experiment.
Great video! Could you maybe explain how to deal with NA values and the LMM?
For NA it really depends on the source of the data, In this example there are removed to simplified the process. For data imputation, you will need to understand the nature of those errors. Some data, for example, environmental temperature might be able to use a simple moving average for its imputation, but for drug interactions, it might be easier to just remove the sample if you have enough data.
Hi, this is really helpful, thanks! I'm trying to watch as many linear mixed model videos as possible to understand the background. If you have time, can I ask, why do you use 1+ attitude/subject and 1+ attitude/scenario, but not 1+gender/subject and 1+gender/scenario, is this because you don't expect slope to change with gender? If so, do you happen to know what equation I would use if I did expect slope to change with gender? To model bat_body_temp. I currently have two fixed effects (ambient_temp and fed_notFed and one random effect individual _bat, just trying to work out what the best equation to use is if I want to assume that the slope might vary for the different individual bats).... thanks!!
There is actually a lot more background from the study I didn't mange to put into the video, you can refer to the intention of the author here:
bodowinter.com/tutorial/bw_LME_tutorial2.pdf
I am not exactly sure about the bat situation, but if you set individual bats as your random variable, would it hurts your statistical power since you only have 1 data point per bat? or are you working with longitudinal data in your study?
equation:
bat_body_temp ~ gender + ambient_temp + fed_notFed + (1|individual _bat)
@@LiquidBrain thanks very much for the reply, I'll have a look. I have several (~6 or 7) bat_body_temp points per bat for various different ambient temperatures and for both fed/not_fed conditions. I don't actually have male and female bats they were all male, just was wondering hypothetically about the equation. I think if I read more I will understand. Need some spare time to work on it!! Thanks again :)
Liquid brain, Many terms I couldnot understand. What is difference between linear, regression, and correleation
To oversimplified a bit,
Linear = a line, or line like stuff
Regression = trying to fit a model into a data
correlation= does the two dataset looks similar to each other
Please make toturial on how we can use random forest and bortula in R software for analysis with regression and classifier
That sounds like an interesting idea :) Let me see what i can do
"Not the worst thing in the world." (7:46) 😂😂
The music is distracting.
Your model has two levels. It would be better to talk about linear mixed model by levels and also show people the regression equations by levels.
Its called multivariate model
13:42 - a proper scientist saying gender is fluid - hmm; in any case what relevance does that have here?
Good explanations, but please delete the backgound noise soundtrack. It is unnecessary and annoying.
the song is not necessary. It is so hard for non-native speakers to understand your lesson with the song. This is only a suggestion.
Gas brain?