interesting example! But I still have a question: in this example, reason for causing failure is that individuals have different weights at begin, if we use traditional liner model and just adjust this factor as a covariate, is that ok? and what's the different between the two models?
Thanks for your answer, sorry, I just misunderstood the meaning in 7:00, I watched it again. And if the LMM is the blue line, is LM the orange line, which means the two methods are different in shape and position? And there is a suppose that random effects should have more than 5 levels, or you can use the fixed effect, is that means in that way LM is equal to LMM (for LM just include fixed effect)?
Hello Andreas. First, congratulations on your magnificent videos. They are crystal clear and a very good resource. I have made some calculations and it seems that the linear regression model matches the one you showed at the beginning of the video, although the intercept I calculated is 93.0. The rest is the same as you. I don't know if I am missing something. Thank you!
Excellent explanation! If we have a linear model lm2=weights ~ weeks + personId, then Sum of Squared Error or Residual Standard Error will be 11.8 which is close to LMM model with random intercepts. And Even more if we use a interaction terms "weeks*PersonID" then SSE is 4.5. So, how do we explain the benefits of LMM for these models?
In addition to the things that I discuss in the video, such as that of assumptions, you need to estimate more parameters in the LM model. If we would have 100 individuals, the LM would estimate at least 100 parameters with associated p-values (which affect the degrees of freedom). Since we are not interested in making inferences on each individual, it makes more sense to use LMM because you then treat the individuals only as a random effect.
can I find somewhere examples of random coefficient models where the variable of the random coefficient is not continuous but categorical? ideally written with STATA or SPSS?
@@tilestats thank you for your answer. The example is with weeks as continuous (slope). Was there a random coefficient with a categorical variable that I missed?
I really enjoyed your video and I have a few questions. Could you please explain when a linear mixed model can be used in situations where there are missing values, such as when only two time points are measured and some subjects are not measured at one of the time points? Also, I'm curious if the random intercept model(two measurements) still has the same p-value as ANOVA with paired-t when dealing with missing values. Thank you!
There is absolutely nothing wrong with the fixed effects model. Using a dummy variable for each individual captures the dependence within individual that would otherwise be there. In fact, it is a more robust solution since the normal assumption may be incorrect. In the example you give, there is absolutely no reason to make the almost untestable assumption that the intercepts a a draw from a normal distribution. And if we are are interested in the effect of dieting, why would we make an extra untestable assumption. Bottom line is that RE models are ill-advised in most situations. BTW: I am a Professor of Statistics.
At 8.21, you say that "multiple leaner regression model does not give an overall intercept". This is confusing as it is actually the expected value of the response variable when all predictors equal zero. Please clarify.
Multiple linear regression gives intercepts for each individual in this example, but the output does not give an overall (mean) intercept for all individuals.
Thank you so much for your excellent explanations. Can you please create a video that explains in simple terms that when we should consider a variable "random" and when "fixed"? As some feedback, is it possible to pronounce "d" in the word "moDel"? You pronounce it "moWel". This and other odd pronounciations distract the listener.
At 11:26, -6.0, -18.0 and -21.0 are not intercepts. They are slopes of Subjects 2, 3 and 4 with the slope of Subject 1 as the reference. Please correct me if I am wrong.
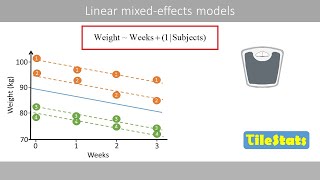
All individuals have the same slope because the lines are parallel. -6.0, -18.0 and -21.0 are how much lower the intercepts are for subject 2, 3 and 4 compared to the reference person, which is person 1.
@@tilestats Thanks for reply but my question is how can we talk about individual slopes in a simple linear model which is not a mixed effects model. In a LM there is one overall intercept and every independent variable has a slope associated with it but you are associating intercepts with every individual independent variable. Can't get it.
A simple linear regression model like this (as explained in the beginning of the video): Weight = intercept + Weeks can only have one intercept. Using a multiple linear regression model, we can treat the individuals as a factor (because we have repeated measurements of the same subjects): Weight = intercept + Weeks + Subjects This model has several intercepts. Have a look at my video about multiple linear regression to get the basic idea to include a factor in linear regression: ruclips.net/video/AP_K7SaKkIE/видео.html
I can just don't get how you explain the interaction time:group of intervention in a simple clinical trial in a longitudinal study. When is significant time:group of intervention, does it mean that time has an effect on the results? But the patients are under a trial intervention? This means something I guess. How would you explain it?
The interaction time:group (for example Group A and B) means that group A and B have different slopes. Have you seen my second video about Linear mixed-effects models? In this video, I show that the ones on diet A lose weight faster compared to the ones on diet B, given that the interaction term is significant.
@@tilestats I have seen it now, really good video and it explains the evolution of the 2 diets across time. So, imagine if you just have one group, measuring the effect of diet 1 across time; how would you put it in words that time as a covariate has a significant value?
In this example, the intercept is random whereas the slope is fixed (because all 4 individuals are assumed to have the same weight loss). Watch the second video, which will give you more examples between random and fixed effects: ruclips.net/video/oI1_SV1Rpfc/видео.html
@@tilestats my samples are small (16 /16) and only random assignment was conducted, so I am violating one assumption (random selection)...what are the best tests for testing the means differencs withing groups and between groups? Thank you!
If you took a sample of 32 independent subjects and randomly assigned them into two groups, it sounds like an unpaired t-test is appropriate. Have a look at this video: ruclips.net/video/dYJLUvo0Q6g/видео.html


I could not totally understand the mixed-effects model until I watched this video. Thank you very much.
interesting example! But I still have a question: in this example, reason for causing failure is that individuals have different weights at begin, if we use traditional liner model and just adjust this factor as a covariate, is that ok? and what's the different between the two models?
From 7:00 I compare the two methods.
Thanks for your answer, sorry, I just misunderstood the meaning in 7:00, I watched it again. And if the LMM is the blue line, is LM the orange line, which means the two methods are different in shape and position? And there is a suppose that random effects should have more than 5 levels, or you can use the fixed effect, is that means in that way LM is equal to LMM (for LM just include fixed effect)?
Great video! What if I have independent samples across 3 times measurement time?
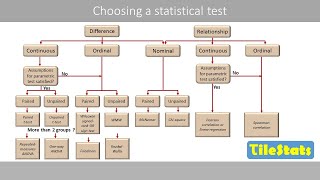
Then you simply use linear regression:
ruclips.net/video/AP_K7SaKkIE/видео.html
Great explanation and the visuals take it to the next level. Thank you very much!
Excellent explanation! I wish I had seen this video years ago, I would have saved myself a lot of time to get in to the topic...
I finally understand the topic! Thank you so much,
This is the best video I’ve seen on this topic.
Thank you very much. This is very helpful for a person who has no prior knowledge to statistic. This will definitely help my research project.
Excellent job explaining this in an understandable way! Thank you so much!
I have yet to see such a good video explaining LMM. Thanks from Zürich!
Spectacularly well explained. Thanks for that.
Superbly explained with great visuals
Fantastic explanation! Thank you :)
this is great, thank you.
Watched four videos on this, and this was the one that made it click. Thanks for your relatable breakdown!
Hello Andreas. First, congratulations on your magnificent videos. They are crystal clear and a very good resource. I have made some calculations and it seems that the linear regression model matches the one you showed at the beginning of the video, although the intercept I calculated is 93.0. The rest is the same as you. I don't know if I am missing something. Thank you!
How did you calculate? Did you use a software?
@@tilestats I calculated it with both SPSS and Medcalc, and the results were the same. I can send you the file if you want. Thank you
Oh, no, sorry, I have checked again and there was an error copying the values. The result is fine
Excellent explanation! If we have a linear model lm2=weights ~ weeks + personId, then Sum of Squared Error or Residual Standard Error will be 11.8 which is close to LMM model with random intercepts. And Even more if we use a interaction terms "weeks*PersonID" then SSE is 4.5. So, how do we explain the benefits of LMM for these models?
In addition to the things that I discuss in the video, such as that of assumptions, you need to estimate more parameters in the LM model. If we would have 100 individuals, the LM would estimate at least 100 parameters with associated p-values (which affect the degrees of freedom). Since we are not interested in making inferences on each individual, it makes more sense to use LMM because you then treat the individuals only as a random effect.
Can you recommend a text (in english) that addresses the broader subject of mixed effects models in just as an understandable way as your video?
No, sorry. Internet is my main source nowadays.
Great explanation !!! Thank you
One more subscriber!! Greetings from Brazil
can I find somewhere examples of random coefficient models where the variable of the random coefficient is not continuous but categorical? ideally written with STATA or SPSS?
Have you seen the second video?
ruclips.net/video/oI1_SV1Rpfc/видео.html
@@tilestats thank you for your answer. The example is with weeks as continuous (slope). Was there a random coefficient with a categorical variable that I missed?
Incredible video!!
Thanks, super clear!
Great video!
I really enjoyed your video and I have a few questions. Could you please explain when a linear mixed model can be used in situations where there are missing values, such as when only two time points are measured and some subjects are not measured at one of the time points? Also, I'm curious if the random intercept model(two measurements) still has the same p-value as ANOVA with paired-t when dealing with missing values. Thank you!
There is absolutely nothing wrong with the fixed effects model. Using a dummy variable for each individual captures the dependence within individual that would otherwise be there. In fact, it is a more robust solution since the normal assumption may be incorrect. In the example you give, there is absolutely no reason to make the almost untestable assumption that the intercepts a a draw from a normal distribution. And if we are are interested in the effect of dieting, why would we make an extra untestable assumption. Bottom line is that RE models are ill-advised in most situations. BTW: I am a Professor of Statistics.
At 8.21, you say that "multiple leaner regression model does not give an overall intercept". This is confusing as it is actually the expected value of the response variable when all predictors equal zero. Please clarify.
Multiple linear regression gives intercepts for each individual in this example, but the output does not give an overall (mean) intercept for all individuals.
@@tilestats So it is only for this example. When does multiple linear regression give an overall slope? Could you please point me towards a case?
Thank you so much for your excellent explanations. Can you please create a video that explains in simple terms that when we should consider a variable "random" and when "fixed"?
As some feedback, is it possible to pronounce "d" in the word "moDel"? You pronounce it "moWel". This and other odd pronounciations distract the listener.
At 11:26, -6.0, -18.0 and -21.0 are not intercepts. They are slopes of Subjects 2, 3 and 4 with the slope of Subject 1 as the reference. Please correct me if I am wrong.
All individuals have the same slope because the lines are parallel. -6.0, -18.0 and -21.0 are how much lower the intercepts are for subject 2, 3 and 4 compared to the reference person, which is person 1.
@@tilestats Thanks for reply but my question is how can we talk about individual slopes in a simple linear model which is not a mixed effects model. In a LM there is one overall intercept and every independent variable has a slope associated with it but you are associating intercepts with every individual independent variable. Can't get it.
A simple linear regression model like this (as explained in the beginning of the video):
Weight = intercept + Weeks
can only have one intercept.
Using a multiple linear regression model, we can treat the individuals as a factor (because we have repeated measurements of the same subjects):
Weight = intercept + Weeks + Subjects
This model has several intercepts. Have a look at my video about multiple linear regression to get the basic idea to include a factor in linear regression:
ruclips.net/video/AP_K7SaKkIE/видео.html
Hi. Great video. Are there any slide or notes for these lectures that are available????
Check my homepage:
www.tilestats.com/shop/
I can just don't get how you explain the interaction time:group of intervention in a simple clinical trial in a longitudinal study. When is significant time:group of intervention, does it mean that time has an effect on the results? But the patients are under a trial intervention? This means something I guess. How would you explain it?
The interaction time:group (for example Group A and B) means that group A and B have different slopes. Have you seen my second video about Linear mixed-effects models? In this video, I show that the ones on diet A lose weight faster compared to the ones on diet B, given that the interaction term is significant.
@@tilestats I have seen it now, really good video and it explains the evolution of the 2 diets across time. So, imagine if you just have one group, measuring the effect of diet 1 across time; how would you put it in words that time as a covariate has a significant value?
That the slope is significantly different from zero, which means that the diet significantly change the weight over time.
Are mixed effect models same as random parameter models?
Yes, it has a lot of names
en.wikipedia.org/wiki/Multilevel_model
Thanks for the explanation, if the subject treat as random effect, then what is the fixed effect?
Not sure I understand your question.
@@tilestats you say in the video, the subject is a random effect, then which variable treat as fixed effect? 🙏
In this example, the intercept is random whereas the slope is fixed (because all 4 individuals are assumed to have the same weight loss). Watch the second video, which will give you more examples between random and fixed effects:
ruclips.net/video/oI1_SV1Rpfc/видео.html
Can this be used as a replacement to T-tests when the samples are small (e.g., 16 per group)?
No, but a t-test works fine for small sampels, as long as you fulfill the assumptions.
@@tilestats my samples are small (16 /16) and only random assignment was conducted, so I am violating one assumption (random selection)...what are the best tests for testing the means differencs withing groups and between groups? Thank you!
If you took a sample of 32 independent subjects and randomly assigned them into two groups, it sounds like an unpaired t-test is appropriate. Have a look at this video:
ruclips.net/video/dYJLUvo0Q6g/видео.html
@@tilestats ok I'll thank you very much for your help!