Hi Richard, First - many thanks for your kind comment, I'm glad that you found the video useful. Excel has three T.TEST functions (Formulas -> More Functions -> Statistical) - these return Probability values rather than a t statistic. I prefer the Data Analysis tool as it gives lots of detail, is easier to teach, and most importantly is easy for my students to understand. Hope this helps, Dr E.
Hi Jaspal, First - many thanks for your kind comments, much appreciated. Yes - I do have more videos that might be useful for you. Just search for my username "eoloughlin" in RUclips to get to my channel. Dr E.
Hi Kok Tung, Thanks for your kind comment, and for watching my video. Don't use a t-test for comparing more than two samples. The test you need to compare 3 samples (or moe) in an ANOVA test. If you go to my channel you will find a video about how to do ANOVA in Excel. Dr E.
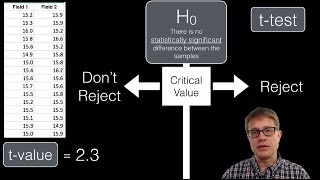
Hi Luke, Check your first values and the degrees of freedom - this will tell you to reject/accept Ho. In the second instance, if your probability is greater than alpha, you must accept Ho. Dr E.
Hi Bruno, Unequal sample size is OK in an ANOVA, But for ANOVA you should compare your original values, not the means (ANOVA does this as part of the test). Think what you are trying to do - are you hypothesizing that your three batches are statistically the same (or different). If so, ANOVA (or MANOVA) may be what you want. Be sure you are using the right test by determining your hypothesis first. Dr E.
This is not just a good video...this is super useful video :) thanks a lot. Dr. Eugene do you have more videos about how to plot the graphs and add statistical values using excel.
I'm not absolutely sure but i think i'm considering they are statistically equal, i sent you a private message via youtube with more detail about my doubts . Thank you very much for your answers
Eugene the video is very good!!! but I have a slight problem! my critical value score worked out to be 2.042 with my t score at -1.3051 so I would reject a null hypothesis but later in the video you show us to work out the probability score mine is greater than alpha at 0.05 so do I accept or reject my null hypothesis?? many thanks luke
Hi I love your video very informative but I am confused on what to pick as my (t-test). I am doing a project on salinity of water and have 5 different values for the salinity of the water with two groups deep water and shallow water. Both deep and shallow water have 5 different values. Do I use the paired two sample for means for this or the paired two sample assuming equal variance?
Thank you for your great video. Can we do t-statistic for several groups (not only 2 groups) in Excel? I have 30 different groups of samples and I want to perform the student's t-test to check what variation is statistically significant among my samples. May I ask how I can perform the statistical analysis (t-test) for multiple groups by using Excel?
Hi Mary Anne, There are different type of t-test that you should look up for your work. There is the paired, unpaired, two-sample assuming equal variances, and two-sample assuming unequal variances. Be sure that you determine before your data analysis which one you need. Dr E.
Thank you for answering, i already had watched your video. But still when using one way ANOVA for the mean results i have 3 columns (batch 1 2 and 3) but in the first column i have 5 mean values, and in the other 2 columns (batch 2 and 3) only one mean value each...so i'd be comparing 5:1 in terms of observed values right? very unequal sample size. is this ok to do?
Hi Mick, The degrees of freedom (19) I use in the video is taken from the results table generated by Excel. The formula for calculating the degrees of freedom in a t Test with unequal variance is quite complicated - it is based on the two sample sizes and the two variances. Unfortunealty, I cannot display it in this text-only Reply box, but if you click on the link below to the Real Statistics Using Excel website you will see the formula used (it's the second one on the webpage): www.real-statistics.com/students-t-distribution/two-sample-t-test-uequal-variances/ Hope this helps, Dr E.
I have a serious doubt in my research work. I want to compare the homogeneity between one substance i'm studying between 3 batches( 1, 2 and 3). The problem is that i have 5 samples for batch 1( with 5 mean results resulting from 10 replicates) and only one sample for batch 2 and 3 (1 mean result each, 2 replicates each). How could i do this? Thanks
I tried to use t test in just a very small sample.. like 4 individuals per group.. my manual answer is different from excel.. :( do you think it is because the sample is so small?
Hi Bruno, If you are comparing more than two means I'd suggest an ANOVA test instead. I have a video in my channel to show you to do this, go to RUclips Search and enter the watch code "EV9gn-splM" (without quotes). Hope this helps, Dr E.
Hi Art and Craft with BR, In this case I chose unequal variance because the sample sizes are different. However, you should really carry out an F test to see if the Group A variance (36.73) is significantly different from Group B variance (40.68). You can see how this is done in the following link where I show hos this is done: ruclips.net/video/tscL1fzjSTY/видео.html. Hope this helps, Dr E.
@@EugeneOLoughlin sir what if we find that in alpha 0.05 our f-test value is smaller than critical value but in alpha 0.01 our ftest value is greater than critical value ..should we use both or only measure in 0.05
Hi Art and Craft with BR, An alpha value of 0.01 (99% significance) is a very tough level to work at. it is usually only used where accuracy is very important, such as in a test for a new drug. 95% is good enough in most cases. When you find a significant difference, say at 95%, all you know is that you found a difference. This is also known as the "effect". You should measure this effect and report it in your results. Check out another one of my videos to see how this is done by hand: ruclips.net/video/UrVuEhuyPUU/видео.html. Hope this helps, Dr E.
At the very very end he says two different things..."we can reject the null hypothesis...another words theres no difference between the means" .... "another words there IS statistically a difference between Group A & Group B". WHAT?! I'm confused. It cant be a null hypothesis I thought if there IS a difference- hence "no charge"? Also how the heck did he get the percentage off the t-table? I can't figure out for the life of me where he got the percentage of 95% for that?
Hi House Solace, First - thank you for watching my video all the way to the end! What I am saying is that the Null hypothesis states that there is no difference between the means. Our test statistic calculation provides us with the evidence to reject this statement, which is what I do. Therefore the alternative hypothesis is true - there is a difference between the means. As for the percentage "off the t-table" - this is set by you before conducting the test. What level of risk are you prepared to take that you are making an incorrect decision - in the video I chose 5% (alpha - 0.05), which gives me the 95% value in the table. Hope this makes sense. Dr E.
@@EugeneOLoughlin oooooooooooooh ok. I get it. The percentage makes sense now. What would the percentage be if you used .001 instead of the alpha? And I understand about the null hypothesis. Thank you!
@@housesolace7649 an alpha value of 0.001 represents 99.9% significance - you rarely need to go to this level in statistical tests. It requires an incredible accuracy that is hard to achieve. Generally we are happy with alpha = 0.05 (95%) or 0.01 (99%). Dr E.


Saved me hours of doing each one manually... Thank you! This was so very helpful!
Dr. O'Loughlin being a saving grace to my stats grade for the past four years now
You are an angel sent from heaven. Thank you, every thing you explain is going to give me 10 marks for my assignment. Thank you
:-)
Hi Richard,
First - many thanks for your kind comment, I'm glad that you found the video useful.
Excel has three T.TEST functions (Formulas -> More Functions -> Statistical) - these return Probability values rather than a t statistic. I prefer the Data Analysis tool as it gives lots of detail, is easier to teach, and most importantly is easy for my students to understand.
Hope this helps,
Dr E.
Still relevant in 2021. Great Explanation!!. Thank you Eugene
Hi Jaspal,
First - many thanks for your kind comments, much appreciated.
Yes - I do have more videos that might be useful for you. Just search for my username "eoloughlin" in RUclips to get to my channel.
Dr E.
Hi Kok Tung,
Thanks for your kind comment, and for watching my video.
Don't use a t-test for comparing more than two samples. The test you need to compare 3 samples (or moe) in an ANOVA test. If you go to my channel you will find a video about how to do ANOVA in Excel.
Dr E.
This helped immensely!! It's straight to the point. Thank you for making this available.
Your video was amazing, short and sweet on Excel to find stats I needed for my hw, thank you so much!
Hi Luke,
Check your first values and the degrees of freedom - this will tell you to reject/accept Ho.
In the second instance, if your probability is greater than alpha, you must accept Ho.
Dr E.
This video help me so much on my final stats project. Thanks!
Thank you, Thank you and Thank you! finally some one with a decent video and a good explanation!
Hi Bruno,
Unequal sample size is OK in an ANOVA,
But for ANOVA you should compare your original values, not the means (ANOVA does this as part of the test).
Think what you are trying to do - are you hypothesizing that your three batches are statistically the same (or different). If so, ANOVA (or MANOVA) may be what you want. Be sure you are using the right test by determining your hypothesis first.
Dr E.
You explain very, thanks.
best demo 4 t.test ever
Thank you so much! Helped with one of my college assignments.
Very nice video
Thank you so much for making this video. It was incredibly helpful.
A great help for my dissertation - thanks
This is not just a good video...this is super useful video :) thanks a lot.
Dr. Eugene do you have more videos about how to plot the graphs and add statistical values using excel.
Very Well Explained! Congrats
I'm not absolutely sure but i think i'm considering they are statistically equal, i sent you a private message via youtube with more detail about my doubts . Thank you very much for your answers
very very very helpful.. thank you
This is very helpful. Thanks Doctor. Could you please give dependent sample in SPSS . Thanks.
Thank you so much! Very helpful. :)
So helpful! thank you!!
GOOD
this was helpful. thank you.
Eugene O'Loughlin Thank you very much for the informative video, would the "t-statistic" mentioned here be another name for t-calculated or t-value?
Eugene
the video is very good!!!
but I have a slight problem!
my critical value score worked out to be 2.042 with my t score at -1.3051
so I would reject a null hypothesis
but later in the video you show us to work out the probability score
mine is greater than alpha at 0.05
so do I accept or reject my null hypothesis??
many thanks
luke
Thank you for the video.
great
Thank you very helpful.
Your the bomb! Thanks!
thanks alot
Thank you very much
Hi I love your video very informative but I am confused on what to pick as my (t-test). I am doing a project on salinity of water and have 5 different values for the salinity of the water with two groups deep water and shallow water. Both deep and shallow water have 5 different values. Do I use the paired two sample for means for this or the paired two sample assuming equal variance?
Thank you for your great video. Can we do t-statistic for several groups (not only 2 groups) in Excel? I have 30 different groups of samples and I want to perform the student's t-test to check what variation is statistically significant among my samples. May I ask how I can perform the statistical analysis (t-test) for multiple groups by using Excel?
HI Kourosh,
t Test is not used for more than two samples. What you need is an ANOVA with Tukey tests to tell you where the differences are.
Dr E.
thank you very much
Thanks for your video sharing. May I know how compare 3 group of value for T-test?
hi, why did u choose 2 samples assuming unequal variances instead of 2 samples assuming equal variances for this particular example?
Thank you!!!
Thank you sir, last question... Is there a way of solving t test for related samples? When I am using within-subject design..
Hi Mary Anne,
There are different type of t-test that you should look up for your work. There is the paired, unpaired, two-sample assuming equal variances, and two-sample assuming unequal variances. Be sure that you determine before your data analysis which one you need.
Dr E.
Thanks Dr. E. :D
Hi mentha4,
The samples are not equal - this is why.
Dr E.
Thank you for answering, i already had watched your video. But still when using one way ANOVA for the mean results i have 3 columns (batch 1 2 and 3) but in the first column i have 5 mean values, and in the other 2 columns (batch 2 and 3) only one mean value each...so i'd be comparing 5:1 in terms of observed values right? very unequal sample size. is this ok to do?
Thanks a lot Dr..... But, would you please tell me how to know if my samples have equal or unequal variances?
Try my video about this: ruclips.net/video/tscL1fzjSTY/видео.html
I just notice that your df is 19.. how come? n-2 right?
Yup - one for each sample.
Dr E.
Because he used "assuming unequal variances." If he used assuming equal variances, which I think is more common, then df is 21.
Thank you. :)
Thank you
Why would you look up that value if it is noted in your t-test?
how do you have a sample size of 13 and 10 yet have 19 degrees of freedom, shouldn't it be 10+13-2=21?
Hi Mick,
The degrees of freedom (19) I use in the video is taken from the results table generated by Excel.
The formula for calculating the degrees of freedom in a t Test with unequal variance is quite complicated - it is based on the two sample sizes and the two variances. Unfortunealty, I cannot display it in this text-only Reply box, but if you click on the link below to the Real Statistics Using Excel website you will see the formula used (it's the second one on the webpage):
www.real-statistics.com/students-t-distribution/two-sample-t-test-uequal-variances/
Hope this helps,
Dr E.
@@EugeneOLoughlin Thank you!
nice video. but how do we know which t-test to use? i tried searching it but dont get it??
I have a serious doubt in my research work. I want to compare the homogeneity between one substance i'm studying between 3 batches( 1, 2 and 3). The problem is that i have 5 samples for batch 1( with 5 mean results resulting from 10 replicates) and only one sample for batch 2 and 3 (1 mean result each, 2 replicates each). How could i do this?
Thanks
I tried to use t test in just a very small sample.. like 4 individuals per group.. my manual answer is different from excel.. :( do you think it is because the sample is so small?
Hi Bruno,
If you are comparing more than two means I'd suggest an ANOVA test instead. I have a video in my channel to show you to do this, go to RUclips Search and enter the watch code "EV9gn-splM" (without quotes).
Hope this helps,
Dr E.
can anyone explain to me how you do the students t test manually using a calculator in simple terms?
How can we know if we need PAIRED or Independent Ttest???
why do we want to compare means between two samples. by this i mean, what would be real world questions
Hello sir i have a question why we choose t test as unequal variance ?
Hi Art and Craft with BR,
In this case I chose unequal variance because the sample sizes are different.
However, you should really carry out an F test to see if the Group A variance (36.73) is significantly different from Group B variance (40.68). You can see how this is done in the following link where I show hos this is done: ruclips.net/video/tscL1fzjSTY/видео.html.
Hope this helps,
Dr E.
@@EugeneOLoughlin sir what if we find that in alpha 0.05 our f-test value is smaller than critical value but in alpha 0.01 our ftest value is greater than critical value ..should we use both or only measure in 0.05
Hi Art and Craft with BR,
An alpha value of 0.01 (99% significance) is a very tough level to work at. it is usually only used where accuracy is very important, such as in a test for a new drug. 95% is good enough in most cases.
When you find a significant difference, say at 95%, all you know is that you found a difference. This is also known as the "effect". You should measure this effect and report it in your results. Check out another one of my videos to see how this is done by hand: ruclips.net/video/UrVuEhuyPUU/видео.html.
Hope this helps,
Dr E.
@@EugeneOLoughlin thank you so much sir for your answer 🙏
group a had 13 measures, and group b had 10 measures
I am just using small sample just to test it..
My volume is maxed out & I still can't hear the guy
rockNroll ripper .
At the very very end he says two different things..."we can reject the null hypothesis...another words theres no difference between the means" .... "another words there IS statistically a difference between Group A & Group B". WHAT?! I'm confused. It cant be a null hypothesis I thought if there IS a difference- hence "no charge"? Also how the heck did he get the percentage off the t-table? I can't figure out for the life of me where he got the percentage of 95% for that?
Hi House Solace,
First - thank you for watching my video all the way to the end!
What I am saying is that the Null hypothesis states that there is no difference between the means. Our test statistic calculation provides us with the evidence to reject this statement, which is what I do. Therefore the alternative hypothesis is true - there is a difference between the means.
As for the percentage "off the t-table" - this is set by you before conducting the test. What level of risk are you prepared to take that you are making an incorrect decision - in the video I chose 5% (alpha - 0.05), which gives me the 95% value in the table.
Hope this makes sense.
Dr E.
@@EugeneOLoughlin oooooooooooooh ok. I get it. The percentage makes sense now. What would the percentage be if you used .001 instead of the alpha? And I understand about the null hypothesis. Thank you!
@@housesolace7649 an alpha value of 0.001 represents 99.9% significance - you rarely need to go to this level in statistical tests. It requires an incredible accuracy that is hard to achieve. Generally we are happy with alpha = 0.05 (95%) or 0.01 (99%).
Dr E.