How To... Perform a one-way ANOVA Test in Excel 2010

HTML-код
- Опубликовано: 11 сен 2024
- Learn how to use Excel to generate an ANOVA table to test if there is a significant difference (or not) between the means of three or more samples. This method uses Excel's "Analysis Toolpak" Add-In which needs to be added (how to do this is shown in the video).


![BAK Jay - Find Out (For Your Love) [Official Music Video]](http://i.ytimg.com/vi/10FJO_XBCvY/mqdefault.jpg)

Thanks a million! Absolutely clear and precise instruction as well as explanation. Thanks again sir!
Mr. O'Loughlin I thank you so very much for doing this tutorial, you saved my grade in statistics, your instructions were very easy to follow and comprehend ! Thank you truly!
Thanks Eugene. I became ANOVA expert after watch this video.
Thank you posting. I am beginner in the stats fields ,but your videos are quite clear. Thanks again
Now you might be master in statistics
another dissertation saved by this video. thank you.
Thanks, that was extremely to the point and straight forward and well prepared.
Thank you for this video, i really learned a lot.... i hope to witness more videos with detailed explanations and procedures. More Power!
Hi efeosaere,
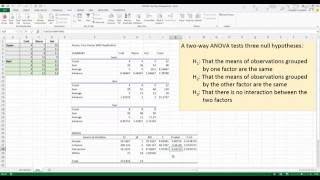
Remember, the hypothesis is that the means are the same. The NULL is that at least two are different.
Dr E.
So much easier to understand. Thankyou
Thanks Eoloughlin
I understand better now
fantastic, very well explained. Really very helpful. Thanks
shhhh... just listen to the nice man's soothing voice.
Thank you, I'm using this in my Quality Management class.
Thank you for the straight forward aid!
Great video! Thank you it was very helpful!
Thank you so much, saved my bum big time...
thank you very clear and understandable!!
thank you....very useful information
...
Thank You, Professor.
very very useful! thank u so much Prof!!! :)
thank you very much! very helpful.
great vid, thx for the explanation.
Thanks a lot
Can you show how to proceed after anova table, means calculation of standard error and critical difference in excel? It will be very helpful.
great video
What was the website where you got the F table from? I couldn't quite hear what you said, unfortunately.
Thanks for the post. I was wondering, if the hypothesis was all the means are different, do you follow the same process?
Before applying ANOVA sir we should know data is normally distributed and homogeneity of variance can we assume both
If you can reject the null hypothesis then hypothesis 1 is true. But how to find out if really all three sets of data's means are statistically significantly different? Thanks for the help!!
Thanks for a detail explanation. how to determine the significance level as 0.5?
Aloke Anand THis depends on the experiment you conducting and the data you are analyzing. 0.05 means that there is a 5% chance that your result will be an (Type I) error, in other words your result is 95% accurate. 0.05 is a normal level of significance to go for. If you need more accurate results, go for 0.01.
Dr E.
nice
what if the p value is more than 0.05, but Fstat is bigger than Fcritical?
How come the values are in the order of millions?
statsoft dot com
Thanks you for watching the video!
Please redo the video...I can barely hear even you at 100%...this is a waste of time/video.
he talks too fast
:-)