How to Run a Paired Samples t-test in Excel

HTML-код
- Опубликовано: 23 авг 2024
- Please SUBSCRIBE:
www.youtube.co...
alphabench.com/...
Test for a mean difference in paired or related samples using Excel. Use output to calculate a confidence interval. Some texts also refer to this as a repeated measures test.
See the following for how to use the T.TEST function to test hypotheses:
• How to Use T.TEST in E...


Massive props to this guy still answering questions since 2012
You have my respect man!
Glad it helped.
Hey, I know this video is 5 years old, but I want you to know that it's still saving people like me a lot of time! This is so much faster than doing the data analysis for my thesis in SigmaPlot - THANK YOU!
Thanks very much. Glad it helped.
Thanks very much. Glad it helped.
Thankyou! Still saving lives after 10 years :)
LOL. Glad it helped.
Thank you!!!! All I needed was the tip about tool pack expansion I was so lost in these tutorials
Glad it helped.
Your tip on adding on the DATA Analysis option is very useful. Thanks
Glad it helped
I enjoyed everything... especially the last part for the confidence interval cost difference between the procedure of the two hospitals.
Glad it helped
Thank you sir l learnt so much from you, apart from all best excel skills you taught one thing l learn is inserting Data analysis tab in my excel (ALT, T and l bring my data analysis option to my excel, really amazing appreciate that) , keep sharing you have best gifted talent of explaining ❤
From University of Papua New
Thanks very much. Glad it helped
Thanks a lot i got stuck putting labels and not checking the box and it messed everything up you are the man!
Thanks. Glad it helped.
I think you might be talking about a different type of analysis, but if you have just two groups with the data is spread over more than two columns you will have to reorganize the data so that it is in two columns. You will also have to make sure each data pair is matched up to get accurate results.
VERY VERY VERY useful. Thanks!!!!!!!!!!!!!
Thank you.
Simple and very well explained - Thank you for sharing
Thanks. Glad it helped.
That helped me out a major amount, thank you!
Glad it helped
Thank you. Very helpful guide!
Glad it helped.
I have a couple of questions
- Is the t test appropriate when the group size is different?
- can the t test be used to compare Weighted Averages from a survey?
Your help on this si much appreciated.
Thank you
John
Hi,
Yes you will use a t-test when the sample sizes are different, but the methodology is the independent samples t-test: ruclips.net/video/qLkBgFdnSU4/видео.html .
If you are comparing two means or two proportions, say the proportion of respondents from one group who responded x vs. another group's x-response proportion, then you can use this methodology. The problem with starting with a weighted average score will be what is the variance? If you weight individual scores and create a new variable for the aggregate score it should work fine.
Thank you for the response it is much appreciated.
Thank you, very helpful and clear!
Thanks. Glad it helped
REALLYYY USEFUL. THANK YOU SO MUCH
Glad it helped!
Hi Matt, Thank you for the very clear description. I'm running some stats for my dissertation and I wondered if I reject my null hypothesis as a result of the following:
t Stat = 4.456076998
P(T
ltyouens
Actually please ignore my stupidity I have realised the P two tail 8.61031E-05 has an 'E' in the figure from Excel, meaning it's a really long number. So I should definitely reject the null H. Thanks.
ltyouens So assuming you have a two-tailed hypothesis test, you reject the null, which is always that there is no difference between paired observations. You can tell this by comparing the t Critical to the t Stat; when the t Stat is bigger you can reject the null. You can also use the p-value, comparing the p to alpha, the level of significance you are testing at. P is the lowest level of significance you can reject the null at.
How do you do this for three variables, e.g. Three hospitals?
Thank you for the video, it was really easy to follow.
For this you would start with ANOVA to determine if there is a difference, you then proceed to pairwise analysis.
Fantastic video!!
Thanks. Glad it helped
Thank you.
Glad it helped
Great Video ! Thankyou Keep it up!
Thanks. Glad it helped.
Simple explanation for the procedure :)
Glad it helped
+Matt Macarty This is so great and I am using it to compile my dissertation research. However I need to write down the formula used and I cant figure out what excel uses to compute this paired samples. Any idea where I could find the right formula used by excel??? thanks
The output was generated using the data analysis toolpak. I think you can use the TTEST or T.TEST function if you want to do it dynamically in the spreadsheet.
Amazing video, thanks!
Thanks, glad it helped
Hey Mark! Is it possible two run a paired t-test with different numbers of observations? Like, lets say you found another cost for the Podunk hospital but not for the other hospital. Although, the observations numbers are different can you still run a paired t-test? This video was very useful, thank you very much!
+Shreya Reddy In order to do a matched pair test you have to have samples of the same size since you are comparing each pair in a stepwise manner.
If I want to use data for a two-sample independent t-test just to calculate confidence intervals... like not going through the data analysis pack... would I do the same process on the actual spread sheet with the data as this video of the dependent t-test? Like go through the same mean of differences, SD of differences, T alpha half, to get the lower and upper bounds of the confidence interval? Are they the same equations?
Courtney Dorris Actually the procedure is quite a but different for independent samples, as you need the variance for both samples so you can pool them. You will need a t-alpha/2 based on n1+n2-2 degrees of freedom. The difference between the two samples is the same though.
Hey Matt i had a question, if my t Stat = 4.06 and my two-tailed p-value = 0.0023 is there a statistically significant difference in my data??
Yes. your p
Assuming your alpha was higher than 0.0023, then yes there is significance here.
hi matt i have a quick question, im analyzing several data and this video helped me. however, i came across a set that is exactly the same. obviously there is no significant difference between the 2 since they are completely the same but since I was tasked to do a paired t test sample for it, what should I put in my t and p values? should it be t-0.000 and p-1.000? Excel shows Error. thanks!
I mean ts and ps are based on a normal distribution which has no upper or lower bound, so technically you cannot have a p of 1. The same is virtually true of t. If you have exactly the same data I don't really see a point in running the test though.
Hi Mr +Matt Macarty, Thank you very much for this video. It is very useful. I tried the test with two data sets over a period of time. Is that correct? The results that 0 hypothesis can be rejected (p=0.0003) but the confidence intervals look too large to me and overlap between the 2 data sets suggesting there isn't any statistical difference. How would you interpret this? Mean value1 10.53& Mean value 2=10.021. Mean difference 0.51; LCI 0.3 and UCI = 3.02. Thank you very much!
+Iordan Hristov It is difficult to say, but I am guessing your sample size is pretty small. Since 0 is not in the interval, it looks like the null can be rejected. This test is specifically for testing between matched pairs, so it would be OK to test two different time series as long as the observations are for the same come from the same time period. For example obs A, and obs B from 01/01, obs A, and obs B from 01/02, etc.
Hi Matt. How would this work if the sample sizes were not equal? Specifically i'm trying to compare the impact of a measure. I have 5 data entries for before the measure was implemented and 26 for after the measure was implemented. So say for example the measure is the provision of energy saving advice to a household. The 5 entries before the measure refer to energy consumption recorded weekly over a period of 5 weeks, and post-measure entries refer to weekly measurements over a 26 week period. I have been asked specifically to used paired sample t-test but am a bit stuck. Any thoughts? thanks very much.
So it sounds like you could compare entries week-to-week either each week or measurements from the beginning week compared to the final week.
Does it matter if the difference is negative or not?
Technically no, but it is easier to interpret when you subtract the smaller mean from the larger one. Or you can take the absolute value of the test statistic.
Thank you for this video! I'd like to find a formula for determining a homogeneous or heterogeneous pair. For example, col A has a true value and column B has a false value. Therefore, column C will show false because the pair is not homogeneous.
I think you may be describing a different testing technique that is used to test differences in categorical data. this would require a chi-square test. Then again if you are unsure if the pairs are matched you can run an independent samples test. The mean difference remains the same however the test statistic methodology is different and typically the null is somewhat harder to reject:
ruclips.net/video/qLkBgFdnSU4/видео.html
I found the solution. I did a table formatting and it's amazing the added features of the formatted table!! Amazing! Instead of each column saying something like =A1+B1, Excel replaces that with =[@[ColumnA]]+[@ColumnB]]. So I did that with adding the two statements:
=IF(ISODD([@[V Odd]]+[@[C Odd]]),TRUE,FALSE)
This worked out great! Thank you for your reply. You are awesome!
Glad it helped
Hi, is there a reason why you would select the group with the larger mean first?
Selecting the larger mean gives you a positive test statistic. The test comes out the same either way but sometimes its easier to deal with a positive number.
I get 2 completely different results on the 2 tailed test though
Hi matt, want to ask how come my excel will appear like that (P(T
It's scientific notation, or Excel's version of it. It means 0.000000282.
@@MattMacarty owhh that is great, thanks matt
Hi, I'm trying to find tests to do with some data I have on numbers of exchange students in Japan over the last 10 years (hoping to find some proof that covid has lessened the numbers)
I would like to do this test but the data I have is like 100,000 students from Asia and 7,000 from Other countries (with a list of different countries and the numbers) in 2020 and 150,000 from asia and 1500 from other places in 2019...
Is this the right test to use?
I think because my values within the sample are so different in variance it doesn't work????? im not sure....
I think probably want to compare means and this may be a simple hypothesis test where you compare the average number of students/year to the number post covid.
@@MattMacarty thank you for your reply!!
So do you mean just compare the means? Or is there something called a ‘simple hypothesis test’?
So I think this is looking for a change. You calculate the mean, then pull out the value you think is different and calculate your t statistic. This is a simplification, but essentially what the procedure is. Probably refer to the first hypothesis testing chapter in any stats text.
is your Hypothesized MEAN dIFFERENCE, the null and alternate hypothesis?
+Joshua Pritt So the null is there is no difference, or any difference we observe is due to sampling error and the alternative is that the difference we see is significantly different from 0.
Are you sure this is a paired t-test? A paired t-test applies to the 2 results on the same subject. For example the cost of the same procedure after a certain intervention. If you are comparing the cost of the same procedure between 2 hospitals, shouldn't that be an independent t-test?
Yes what you describe is one application of paired samples. These kinds of tests are also called matched or related samples. When everything else is the same except the location of the test the paired sample test is appropriate. I suppose you could make other arguments like the doctors at one hospital aren't as good as those at the other, but we are not trying to show anything other than the cost of the tests are cheaper on average at one location. The cause of this would be the subject of further study. There are many other examples of where this method can be used in settings other than a "before and after" design.
Thank you so so much
Glad it helped
My t stat has come out as 70 and my P is showing as 0, does that mean I've done something wrong? I've got a pretty big df (2114) but I don't know if that makes a difference. I'm so confused, please help!
So a couple of things. If you have a big enough sample pretty much anything will look significant. Second no I don't think you have necessarily done something wrong. You can get big t-statistics when you have a big response, and the bigger the sample size the bigger your t-stat will be. Your p-value isn't actually 0 but it is very small based on your t-stat.
@@MattMacarty Omg wow thankyou so much for replying and for helping! Would you suggest using a smaller sample size? I thought the bigger the sample size the more accurate the results would be but I could just only look at half the observations if that is likely to help
@@georgia_bh Hi, yes usually bigger is better, but it depends on what you are doing. If you are trying to estimate a proportion, then you typically need really large sample sizes to get a smaller margin of error. When testing a response hypothesis on a mean, big samples can be misleading. The same is true on linear regression where we can show pretty much any slope is significant with a large enough sample. For a typical test of a mean difference, you can use samples as small as 30 but probably not bigger than 100
@@MattMacarty I appreciate your help so so much! I'm currently writing my dissertation and this is invaluable
thank you
Glad it helped
ty
Glad it helped
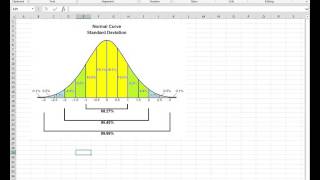
how did you get the 95%?
This is a typical confidence level. It would be given by the problem, but is usually presented in terms of alpha. In this case, alpha would be 0.05, or 5%.
Yeah Richard
glad it helped
You sound like Richard in "Friends." :D
Maybe you could have picked a better question, the question is phrased is more suitable for an independent samples t test.
+Jessica Pichati So what we have here is the same test being conducted at two different hospitals, the tests are matched and the only difference is the hospital. All things being equal we might expect that the same test conducted at different hospitals should cost the same. Actually I can't really do this with independent samples since if I sample tests at random from each hospital any difference I observe may well be from the difference absolute test cost. For example what if I randomly get things like MRI, CATSCAN from one of the hospitals and simple blood tests from the other? If this happened we wouldn't really be showing anything other than blood tests cost a lot less than MRIs.
what is the problem if I got a results of #DIV/0!?
It means somehow your divisor is 0, so you must have an work in the formulation.
@@MattMacarty my values for variable 1 are all the same (e.g. 1.0) and for variable 2 are all also the same, does it affect my results? so that's why it just gave #DIV/0?
@@ramillucas2117 Yes. If your values are all the same, your std dev. is 0
are there any statistical analysis to compare my two variables except for paired t-test?
@@ramillucas2117 So the paired analysis is used to determine whether the mean has changed due to some "treatment". There are other factors to consider for sure.
WHAT IS THE ALPHA?????
+moopadooop The alpha is set in the test dialog box. I left it at the default of 0.05
Ahoy tune .
Thanks