Leverage and Influential Points in Simple Linear Regression

HTML-код
- Опубликовано: 21 дек 2012
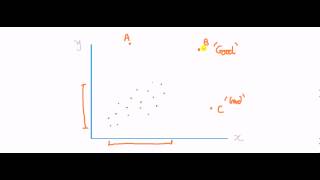
- A brief introduction to leverage and influence in simple linear regression. This video is about the basic concepts, and only briefly mentions numerical measures of leverage and influence near the end of the video.


I read a whole PDF of many pages from school, and still did not have a clue about this, but in only 7.13 minutes you clarified all of my questions. Thank you very much!
facts
just finished watching over 60 odd some videos. This has helped me through your course a huge amount. Great job with the videos and please keep up!
Excellent mini-course. Thank you for all your insights and hard work!
Your videos are so clear and concise. I go back to them over and over to review and absorb statistical concepts. Your channel is the best on youtube for that. Thank you!
indeed
Thank you for helping me understand a concept that was so woolly before. You are a great teacher!
On point as always. One of my favorite and one of the best statistical instruction sources out there! Thanks a lot!
I'm glad to be of help!
Once upon a time, I went to University to learn leverage and Influential points. And I became history then.
This time it has perfectly stored in my brain.
You are awesome.
I always follow your videos, and this one was like a phenomenon to me. thank you so much man, indeed. I really appreciate that.
better then a top 20 uni lecturer.... ffs....why should I go to the uni
Facts
This is a wonderful video. Easy to follow and the topic is very well explained . Thanks
Very clear and intuitive explanation! Thank you!
I'm glad to be of help. Thanks for the kind words and best of luck on your exam!
You're very welcome! I'm glad it helped!
Excelent video! Great explanation.
Very clear explanation of leverage. Thank you :)
This is the answer I was looking for! Great video!
+merumomo Thanks!
Thank you, this is very well explained. My stats course has no lectures, only readings, so videos like this are really helpful!
I'm glad I could help.
Phenomenal instruction. Thanks!
You are very welcome. Thanks for the compliment!
Thanks for the demonstration! Leverage is so much easier to understand now.
You are very welcome!
Great, I finally get it, thanks!
I really started to hate my schools educational system. All it takes is a 2 minutes of the 7 minute video for me the grasp the idea and here I am losing tons of hours staring at meaningless pdfs, shame on absolute zero efforts on teaching. I really appreciate your video! You saved my life and my interest to the statistics by posting this video 11 years ago.
Literally in the same boat as you
You really helped me out here. thank you!
Thank you so much. Respect once and for all
You have got one new subscriber. Thanks a lot !!!
You are very welcome!
Really well explained all the videos . I didn not understood most of it in lecture but your videos made very easy to understand.
+Varun m s I'm glad I could help!
easy way to explained..appreciated
thank you excellent nexplanation
Thank you very much. This is very helpful. The whole playlist is perfect.
You are very welcome. I'm glad you found it helpful!
jbstatistics Do you have videos on multiple regression and building multiple regression models?
hwy133
Not yet. I'm hoping to get to that at some point in the future. Cheers.
Wowww... you are great
thanks , great video
I'm glad to be of help QN00!
jbstatsistics, bless your soul. Your videos are saving my ass in my stats class!!
Thanks for making these great videos!
You are very welcome!
highly informative. thanks a lot
You are very welcome.
@jbstatistics Such a great instructor you are when it comes to statistics !!! Well done man !!! and keep on sharing these amazing videos !!!
Thanks for the compliment!
Thank you.
Brillliant!
awesome video... 2 questions. 1) eliminating such high influential and leverage points can't this lead to overfitting problem ? 2. But if my managment want the estimates for those values (obserations) eliminated , what suggestions can I make ?
Thanks it really helps!!
thank you!
Saved my life.
Thank you so much!
You are very welcome!
clear and awesome! thanks!
You are welcome!
Excellent! Thank you!
You are very welcome!
Thank you so much. It is really helpful to me :D
You are very welcome.
Very interesting
Thank you
You are very welcome!
so useful,thanks a lot!
You are very welcome Lillian!
Hat values or Leverage gauge the influence of the observed value of outcome variable over predicted values. What does it mean??
Good visual explanation only you forget to mention that influence = leverage * discrepancy. Discrepancy is the distance of the Y value to the line. (Studentized residuals; Cook's distance) Anyway, keep up the good work!
Thanks for the feedback. I didn't forget to mention that -- I intentionally brought it up in only a loose way (describing it with a visual illustration), as at the point I cover this in an introductory statistics course students won't have been introduced to studentized residuals, Cook's distance, or measures of leverage. Formally describing Cook's distance, along with its expression as a function of the studentized residual and leverage, is far beyond the scope of this video. Cheers.
Can I use leverage in X multiplied by leverage in Y to make a useful measure of Influence? Seems like a reasonable thing to do, no?
Thank you ))))):
Your voice is cool
Thanks!
Every text book says that an outlier along X has more influence on the regression line. Hence such a point is called an Influential point. But the following example clearly shows that an outlier along Y has more influence than an outlier along X. Best fit line through (-1,-1), (0,0), (1,1) is y = x. Including an outlier along Y, the best fit line through (-1,-1),(0,0),(1,10) is y = 5.5x + 3. Including an outlier along X, the best fit line through (-1,-1),(0,0),(10,1) is y = .1487x - .446. Am I missing something? Thanks in advance for your help.
There's quite a bit to this, and it's tough to give a complete answer to this in a comment. First, points that are extreme in X have high *leverage*, but are not necessarily influential. If a high leverage point falls very close to the overall pattern, then it will not have much influence. If a high leverage point has a Y value that falls far from the overall pattern, then the point will be very influential. As I describe in the video, influence depends on both leverage and how extreme the Y value is.
In the situation you describe, each of the changes result in a point that are extremely influential. If you plot it, you will see that (visually) the magnitude of their influence on the line is similar. However, if we calculate Cook's Distance (a commonly used measure of influence), point 3 has a *much* higher value in the scenario where X is also extreme. (In the original line, none of those points have any influence at all -- the regression line would be the same if any single point were removed.) One reason for this is that the variability of the estimators depends on the variance in X. (Very loosely, if the X's are spread farther apart, with greater variance, than it would be harder to pivot the line.) So, once the much lower variability of the estimators is taken into account, that point is much more influential.
@@jbstatistics Thank you very much for your response. Can you please make a video on this question? Then the confusion will be totally cleared.
You've saved my fucking life
perfect
Thanks!
better than gujarati
why go to uni when youtube is better?
you don't explain the formalue... apart from that it's good
This video is intended to be a light introduction to the topic, one appropriate for an introductory statistics class. The mention of the numeric measures of leverage and influence were intended to be just that, a mention. At some point, I'll try to get videos up explaining that part in greater detail.