This is one the those situations in statistics where you don't have much in the way of options. In my opinion, you would have to restart the study and re-examine your measure to understand why certain types of people are not responding to certain items. It's a very serious issue that a lot of people simply disregard, but any interpretation of the results will be compromised. That's not to say that plenty of people simply carry on after deleting the cases with incomplete data (unjustifiably).
Hi there! Thousand thanks for your tutorial. It has helped me a lot because I could not calculate a total score wit missing data..... Now it's possible. Have a good day. Waiting for more videos...
Do you have to analyze each subscale separately? I tried analyzing everything together and I got some very large numbers and some negative numbers... I am wondering if analyzing each scale separately would have made a difference
He already explained that in the previous video. Data measured on the same scale have higher correlation, and this increases the accuracy of the EM algorithm. Also, because the EM algorithm is resource-intensive, SPSS will crash if you use more data; I think this is irrelevant if you are running the analysis on a proper pc with a decent processor.
Yes, I do believe it is an add-on. I suppose an alternative is to simply use mean replacement. If you were good a multiple regression, you could build a regression equation to predict missing values.
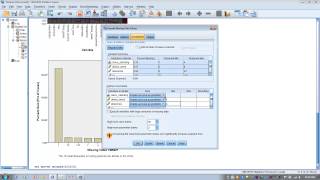
Great video! It would have been nice to have an explanation of the Little's test within this video (since it provides the output anyway) to avoid having to go watch another video.
What if the MCAR with ALL your values and subscales was non-significant but now, doing all subscales separately as you suggest here, the MCAR under the EM Means table for one of the subscales comes up as significant?
For the imputed values, do you recommend rounding up or down rather than retaining the mean? Likert scales are discrete. Say we have a scale of 1 to 5, a value of 2.5 doesn't exist. So, for any value > .5, would it be ok to round up and round down any value < .5? So, if 2.5, that would be rounded to 3.
I have a scale with 8 items; 2 items have no missing data, 5 items have 1 missing (.7 %) and 1 item has 5 missing ( 3.6%). Little's test result is stat sig with or without the large item (5 missing). I'm not sure how to interpret this or how to proceed - please help! -- thank you - your videos are very helpful...
Hi there, Thank you for this video. I am an ex-student of yours and am currently doing my PhD. My data set is quite large N=130 3 conditions 5-time points 6 questionnaires at each time point ( all of these questionnaires have subscales). Would the best way to obtain the best expectation maximization be to manually go through each subscale for each questionnaire at each timepoint by condition (condition as the categorical variable)?
How to input missing values for categorical variables? EM is not available when I drop variables to the categorical variables box. And when I run it through the quantitative variable box, I get non-integers numbers!
This is a really helpful tutorial and I've used the technique before and it worked great. However, I now want to use it again for a different study and it's only replacing MVs for the quantitative variables (I have some categorical variables that also have MVs) - can you advise how to manage this issue please?
What if the EM method replaces the missing data with higher values outside of the value range that a variable should have? for example, a variable should have min value 1 and max value 5, but the EM method replaces some of the missing data with numbers bigger than 5.
My only guess is that you are including too a large a number of variables in the analysis. Try reducing to about 10 to 12 variables which are moderately correlated with each other.
Hello, if you have an item on a scale without answers can you do a EM for the item for all participants? I have a scale with 32 itens but item 31 was missing on the questionnaire i tried this approach and the item appear with 0 on spss instead of a calculated score. Could you tell me why this happened? Thanks
Hello Sir, Thanks so much. It was a very instructive video. Now I have question, regarding my problem. I have QT interval data (ECG parameter) for 10 patients where data is taken each hour starting from 8 AM until 4 PM to see the effect of drug. Data from 8AM is the baseline recording where all were present. There are some missing values for some patients who were not available in some hours.
What do you do when you have a categorical variable? I tried this technique and two of my variables are categorical and I had labelled missing as 999 and it did not impute in the categorical variables (Nominal, 1,2)
Huh? My university statistician said to just put them under the scale variables and I think it worked but he also said they would not be rounded and they came out rounded so I'm still stumped
Thank you for this video. I have an iteration question. When I Replace Missing Values - Expectation-Maximization - SPSS (part 2) SPSS automatically defaults to 25 maximum iterations and my data is imputed. However, I receive the following message: The EM algorithm failed to converge in 25 iterations. Should the algorithm be able to converge? When I increased my iterations my data does not appear to be imputed.
Very helpful video, thanks so much! One question: does one need to divide the dataset (like you did with a and b) in the EM? Or can it be done as a whole? My data all comes from a five-point likert scale questionnaire, for example.
Looks like seven-point ordinal variables to me... If you are planning on using subsequent non-parametric procedures (Wilkoxon signed rank, Kruskall-Wallace, Mann-Whitney U, Cliff's delta), I wouldn't use this method (with rounding of imputations) as it could lead to substantial bias in some or all of the generated paramters. See: Wu, W., Jia, F., Enders, C. K. (2015). A comparison of imputation strategies for ordinal missing data on Likert scale variables. Multivariate Behavioral Research, 50(5), 1-20. If missing values are minimal and Missing Completely at Random (p > .05), probably better to go with listwise deletion. Otherwise, if you have time, go with 'latent variable approach' to imputation in MPlus along with subsequent hypotheses testing in a number (perhaps 50) of generated datasets (see MPlus code on last page of Wu et al. (2015) article.
I think one needs the missing values add on to do what you have done here. If one does not have the add on then is there an alternative approach ? Please answer.
Hi, thank you for your videos; they are very beneficial. I have a question about the data with different groups. For instance, in my data set, I have a sample with autism and neurotypical groups. While calculating EM, should I separate groups? Does EM estimate missings based on each individual's answers on a given sub-scale, or does it consider the whole sample while calculating it? Thank you so much again.
Help! I have a data set where the missing data comes from my participants not completing entire measures. There is no missing item level data (i.e. measures were either completed perfectly or not at all). Can I use EM to impute what certain participants total scale or subscale scores would be? Also how would I group my variables when testing MCAR or running the EM imputation being that I only have total scale and in some cases subscale scores? Thanks for your amazing videos btw.
OK, statman, great tutorial. I have a question. I followed the above procedure on one of my scales. My scale was made up of seven 5-point rating scales (N=467), with 4 random values missing. However, when providing descriptives of the resultant scale, it shows that the four imputed values to 2 decimal places. Given it was in fact a 5-point rating scale, should I round the four imputed values to whole numbers before providing a descriptive?
I had a few responses missing from a scale which was a Likert scale 0-4. However by using this method, SPSS has filled in the missing response with '1.91' for example. Obviously the response needs to be a whole number (0,1,2,3 or 4). Is this a problem? Is there anything that can be done for the number to be replaced with a whole number?
Can one apply EM to repeated measures data sets? In other words, can one consider each data point in a series of data points as belonging to the same "subscale."?
Thanks for an excellent video.. In my questionnaire, I have 13 constructs that I am measuring with 61 items (each construct has between 4 and 5 items). Do I have to impute the items for each construct separately and then merge them together? Why can't I do all of them in one go? Thanks, Hussein
It depends how inter-correlated the items/subscales are. My hunch is that you should just use the items within a scale, which means you'll have to run the analysis separately for each subscale.
+how2stats i have 9 exogenous variables (management support, task interdependence, organizational rewards,..etc) that explain one endogenous or intermediate variable ( knowledge sharing) which in turn explain three other endogenous variables (job performance, innovative behavior, and citizenship behavior).... Do I have to do the run for the items related to each variable separately? Or the program SPSS should be able to differentiate the variables based on their names (e.g.MS1, MS2, MS3, MS4 for management support,..)..Thanks
I don't know if there is a definitive answer to this issue; in the case of values that exceed the theoretical range, you may be wise to round down/up; in the case of obtaining decimal placed values, I'd keep them that way, rather than round down/up.
Hey. Thanks for the video. I have a question though. At the beginning I asked for the gender, since males and females would get different videos to watch and then answer questions too. Therefore females have not answered the "male" items, and vice verca. Those are listed as -77. Those missing is fine and I dont want to replace those. However sometimes they missed an item, which then is listed as 0 (not possible since my likert scale is form 1 to 7). How do i replace the 0 with the mean but not the others? both are listed as missing which i want but I want the replace the 0..... HELP
I'm not an expert, but given that nobody answered. What I think you can do is to have two subsets (males and females) and perform EM on both separately. After all, they are answering different questions. Otherwise, I think SPSS considers that there are no differences in missing values.


This is one the those situations in statistics where you don't have much in the way of options. In my opinion, you would have to restart the study and re-examine your measure to understand why certain types of people are not responding to certain items. It's a very serious issue that a lot of people simply disregard, but any interpretation of the results will be compromised. That's not to say that plenty of people simply carry on after deleting the cases with incomplete data (unjustifiably).
Am loving all of the videos from your series I've seen so far. I can't find one from you on multiple imputation - did you not make one? Thanks.
Hi there! Thousand thanks for your tutorial. It has helped me a lot because I could not calculate a total score wit missing data..... Now it's possible. Have a good day. Waiting for more videos...
Thanks so much...your video and instructions are clear and concise - great help!
Do you have to analyze each subscale separately? I tried analyzing everything together and I got some very large numbers and some negative numbers... I am wondering if analyzing each scale separately would have made a difference
I have a question, why we should do the replacement process separately for each variable's items as you did in the video for (a and b)?
Thank you
He already explained that in the previous video. Data measured on the same scale have higher correlation, and this increases the accuracy of the EM algorithm. Also, because the EM algorithm is resource-intensive, SPSS will crash if you use more data; I think this is irrelevant if you are running the analysis on a proper pc with a decent processor.
Yes, I do believe it is an add-on. I suppose an alternative is to simply use mean replacement. If you were good a multiple regression, you could build a regression equation to predict missing values.
Great video! It would have been nice to have an explanation of the Little's test within this video (since it provides the output anyway) to avoid having to go watch another video.
Most helpful stats vids I've found, THANK YOU.
Very useful and well explained. Thanks!
you are saving my phd - thank you xxx
What if the MCAR with ALL your values and subscales was non-significant but now, doing all subscales separately as you suggest here, the MCAR under the EM Means table for one of the subscales comes up as significant?
Thanks for the video. Could you elaborate why MI is called more sophisticated than EM?
Awesome video!! Thanks for being so clear
For the imputed values, do you recommend rounding up or down rather than retaining the mean? Likert scales are discrete. Say we have a scale of 1 to 5, a value of 2.5 doesn't exist. So, for any value > .5, would it be ok to round up and round down any value < .5? So, if 2.5, that would be rounded to 3.
This is a big help. Thanks very much!
I have a scale with 8 items; 2 items have no missing data, 5 items have 1 missing (.7 %) and 1 item has 5 missing ( 3.6%). Little's test result is stat sig with or without the large item (5 missing). I'm not sure how to interpret this or how to proceed - please help! -- thank you - your videos are very helpful...
Hi there, Thank you for this video. I am an ex-student of yours and am currently doing my PhD. My data set is quite large
N=130
3 conditions
5-time points
6 questionnaires at each time point ( all of these questionnaires have subscales).
Would the best way to obtain the best expectation maximization be to manually go through each subscale for each questionnaire at each timepoint by condition (condition as the categorical variable)?
How to input missing values for categorical variables? EM is not available when I drop variables to the categorical variables box. And when I run it through the quantitative variable box, I get non-integers numbers!
This is a really helpful tutorial and I've used the technique before and it worked great. However, I now want to use it again for a different study and it's only replacing MVs for the quantitative variables (I have some categorical variables that also have MVs) - can you advise how to manage this issue please?
Thanks for this. Also saving my PhD. Can you suggest a reference I can use to justify this please?
Thank you for the video. I just wonder if this would work if I run the MCAR test and the result was significant?
hello, i did EM for the missing data, and the value spss estimated did not correspond with the variables' coded. what could be the problem?
Hi,
I am interested in using EM technique on 2 scales: one has 21 items and another 12 items. All are asymmetrically distributed (Kolmogorov is
What if the EM method replaces the missing data with higher values outside of the value range that a variable should have? for example, a variable should have min value 1 and max value 5, but the EM method replaces some of the missing data with numbers bigger than 5.
My only guess is that you are including too a large a number of variables in the analysis. Try reducing to about 10 to 12 variables which are moderately correlated with each other.
Hello, if you have an item on a scale without answers can you do a EM for the item for all participants? I have a scale with 32 itens but item 31 was missing on the questionnaire i tried this approach and the item appear with 0 on spss instead of a calculated score. Could you tell me why this happened? Thanks
Hello Sir, Thanks so much. It was a very instructive video. Now I have question, regarding my problem. I have QT interval data (ECG parameter) for 10 patients where data is taken each hour starting from 8 AM until 4 PM to see the effect of drug. Data from 8AM is the baseline recording where all were present. There are some missing values for some patients who were not available in some hours.
Should missing DVs be imputed this way (along with other missing variables), and if so, should the cases with imputed DVs be used in an analysis?
What do you do when you have a categorical variable? I tried this technique and two of my variables are categorical and I had labelled missing as 999 and it did not impute in the categorical variables (Nominal, 1,2)
Cwtw
Huh? My university statistician said to just put them under the scale variables and I think it worked but he also said they would not be rounded and they came out rounded so I'm still stumped
Must it be done for each subscale separately?
Thank you for this video. I have an iteration question.
When I Replace Missing Values - Expectation-Maximization - SPSS (part 2)
SPSS automatically defaults to 25 maximum iterations and my data is imputed. However, I receive the following message: The EM algorithm failed to converge in 25 iterations. Should the algorithm be able to converge? When I increased my iterations my data does not appear to be imputed.
Very helpful video, thanks so much! One question: does one need to divide the dataset (like you did with a and b) in the EM? Or can it be done as a whole? My data all comes from a five-point likert scale questionnaire, for example.
Could you add a link to your multiple imputation video? I`ve looked for it but can`t find it.
In this scenario, to predict the missing values shall I take all the ten variables together in the EM algorithm..?
Looks like seven-point ordinal variables to me... If you are planning on using subsequent non-parametric procedures (Wilkoxon signed rank, Kruskall-Wallace, Mann-Whitney U, Cliff's delta), I wouldn't use this method (with rounding of imputations) as it could lead to substantial bias in some or all of the generated paramters. See: Wu, W., Jia, F., Enders, C. K. (2015). A comparison of imputation strategies for ordinal missing data on Likert scale variables. Multivariate Behavioral Research, 50(5), 1-20. If missing values are minimal and Missing Completely at Random (p > .05), probably better to go with listwise deletion. Otherwise, if you have time, go with 'latent variable approach' to imputation in MPlus along with subsequent hypotheses testing in a number (perhaps 50) of generated datasets (see MPlus code on last page of Wu et al. (2015) article.
I think one needs the missing values add on to do what you have done here. If one does not have the add on then is there an alternative approach ? Please answer.
For some reason, it doesn't work in my dataset. Values still missing all over the dataset
Hi, thank you for your videos; they are very beneficial.
I have a question about the data with different groups. For instance, in my data set, I have a sample with autism and neurotypical groups. While calculating EM, should I separate groups?
Does EM estimate missings based on each individual's answers on a given sub-scale, or does it consider the whole sample while calculating it? Thank you so much again.
Hi, I am just wondering if there is something wrong with my dataset when I get negative values after EM, while the scoring range is from 1 to 7? :(
Help! I have a data set where the missing data comes from my participants not completing entire measures. There is no missing item level data (i.e. measures were either completed perfectly or not at all). Can I use EM to impute what certain participants total scale or subscale scores would be? Also how would I group my variables when testing MCAR or running the EM imputation being that I only have total scale and in some cases subscale scores? Thanks for your amazing videos btw.
OK, statman, great tutorial. I have a question. I followed the above procedure on one of my scales. My scale was made up of seven 5-point rating scales (N=467), with 4 random values missing. However, when providing descriptives of the resultant scale, it shows that the four imputed values to 2 decimal places. Given it was in fact a 5-point rating scale, should I round the four imputed values to whole numbers before providing a descriptive?
Hi,
Did you ever figure out what to do if your EM Algorithm failed to converge?
I had a few responses missing from a scale which was a Likert scale 0-4. However by using this method, SPSS has filled in the missing response with '1.91' for example. Obviously the response needs to be a whole number (0,1,2,3 or 4). Is this a problem? Is there anything that can be done for the number to be replaced with a whole number?
What can you do if you get a EM failed to converge error?
can i apply this method in categorical dataset?
Thanks!
Can one apply EM to repeated measures data sets? In other words, can one consider each data point in a series of data points as belonging to the same "subscale."?
Yes!
@@how2stats Thanks!
thanks a lot
Thanks for an excellent video..
In my questionnaire, I have 13 constructs that I am measuring with 61 items (each construct has between 4 and 5 items).
Do I have to impute the items for each construct separately and then merge them together? Why can't I do all of them in one go?
Thanks,
Hussein
It depends how inter-correlated the items/subscales are. My hunch is that you should just use the items within a scale, which means you'll have to run the analysis separately for each subscale.
+how2stats i have 9 exogenous variables (management support, task interdependence, organizational rewards,..etc) that explain one endogenous or intermediate variable ( knowledge sharing) which in turn explain three other endogenous variables (job performance, innovative behavior, and citizenship behavior).... Do I have to do the run for the items related to each variable separately? Or the program SPSS should be able to differentiate the variables based on their names (e.g.MS1, MS2, MS3, MS4 for management support,..)..Thanks
Thanks for sharing. I still run into the same problems as reported by Amber Abbs, mariakiska and Alda Xhabrahimi (see below). Any help?
I don't know if there is a definitive answer to this issue; in the case of values that exceed the theoretical range, you may be wise to round down/up; in the case of obtaining decimal placed values, I'd keep them that way, rather than round down/up.
Hey. Thanks for the video. I have a question though. At the beginning I asked for the gender, since males and females would get different videos to watch and then answer questions too. Therefore females have not answered the "male" items, and vice verca. Those are listed as -77. Those missing is fine and I dont want to replace those. However sometimes they missed an item, which then is listed as 0 (not possible since my likert scale is form 1 to 7). How do i replace the 0 with the mean but not the others? both are listed as missing which i want but I want the replace the 0..... HELP
I'm not an expert, but given that nobody answered. What I think you can do is to have two subsets (males and females) and perform EM on both separately. After all, they are answering different questions. Otherwise, I think SPSS considers that there are no differences in missing values.
I have only one variable in dataset. can i still use little's MCAR test and EM in my case?
+Raz i I'm afraid not.
+how2stats Thank you for the reply
"my cursor is blinking",
oh man, he's gonna start talking about the cursor now!
phew!! near miss..let's go again
I'd say no.