Hi, first of all thank you for this video. I have one question tho, what if I have two ordinal variables (both ordinal ranking scales), is the stacked bar chart still the best option to choose?
'best' is a relative term. If you are interested in simply comparing the results of two ordinal variables, I'd suggest to check out ruclips.net/video/lhwj6WeHEH8/видео.html that might be slightly more suitable.
@@stikpet Okay, sorry to bother you with my next question! but my teachers are not responding...and I really would appreciate if you could help me out. So what if I want to see if there is a relation between the two ordinal variables (both ranked with terms such as satisfied, very satisfied etc.) ? So for example, I want to see if there is relation between the likelihood of repeat purchases and customer satisfaction. Which test should is use (pearson or spearman)? and what is the best graph to show the correlation between them. I did pearson first and used a scatter plot but that didn't seem the right choice since all the dots were not showing anything.
@@STEPHANYIIE1 Ah, a heatmap is what I would do then. Unfortunately this is a bit tricky with SPSS and requires additional Excel. I do have a video on that as well: ruclips.net/video/VieUWpWE1tY/видео.html. You might also be interested in my website at peterstatistics.com/CrashCourse/3-TwoVarUnpair/OrdOrd/OrdOrd0.html and peterstatistics.com/CrashCourse/4-TwoVarPair/OrdOrd/OrdOrdPair0.html as a start. They each have a menu on the left to go over, and include videos for SPSS.
I'm trying to hide legend on stacked bar, is there a way to make the percentage and the name of the variable shows up in the stack bar chart?.. I'm trying to make the name of the variables shows up before the percentage
In the chart editor (the window you get if you double click on the chart in the output) you can adjust many things. In the chart editor if you click on options you can opt for 'Hide Legend' The label of the categories is already by default as the horizontal x-axis title and the ordinal variable label above the legend. Not sure with what you mean by 'making the name show up before the percentage'. Do you mean in each bar for each option showing the percentage and name? If so you can use from the menubar in the chart editor 'Elements - Show Data Labels' and then in the properties window (ctrl+T if it is not showing) at the Data Value Labels tab adjust what you want to see . Hope this is what you were looking for.
I assume you mean to show the percentage values as numbers in the bars. The exact amount is often a fraction or an infine number of decimals. If so you can use from the menubar in the chart editor 'Elements - Show Data Labels' and then in the properties window (ctrl+T if it is not showing) at the Data Value Labels tab adjust what you want to see. Hope this is what you were looking for.
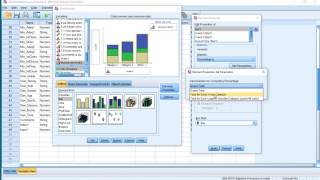
difficult to say without seeing. An obvious one would be in the screen at 01:01 in the video, make sure at 'Bar respresents' the option of 'N of cases' is ticked. Another idea could be that you simply have 100 cases, so then it will show up to 100. Otherwise I would have to do some digging of my own. Which version of SPSS are you using?
@@stikpet So basically I came here through this link of your video: ruclips.net/video/djBtLpW0Bvk/видео.html I have tried like 15 times, followed the same procedure that described in the link I attached and its just same. Spss 20
@@stikpet Jeez! Do you have like an official email, I can send you the video. Yeah that's too direct, I am sorry for that but actually I have a limited time and I am just stuck.
so the other video is if you want one stacked bar for each variable, and this one is if you want a stacked bar for each category in another. If you can send me a screenshot of how you filled out the windows and the result, I can still take a look in the next few hours, and if that doesn't help send me the spss data file then I have a look tomorrow (hopefully that's soon enough for you). My email is stikpet @ gmail .com (without the spaces of course).


Thank you so much for this!! Glad I found your video!
Glad it was helpful!
Thank you for the video. It was very useful.
Glad it was helpful!
Hi, first of all thank you for this video. I have one question tho, what if I have two ordinal variables (both ordinal ranking scales), is the stacked bar chart still the best option to choose?
'best' is a relative term. If you are interested in simply comparing the results of two ordinal variables, I'd suggest to check out ruclips.net/video/lhwj6WeHEH8/видео.html that might be slightly more suitable.
@@stikpet Okay, sorry to bother you with my next question! but my teachers are not responding...and I really would appreciate if you could help me out. So what if I want to see if there is a relation between the two ordinal variables (both ranked with terms such as satisfied, very satisfied etc.) ? So for example, I want to see if there is relation between the likelihood of repeat purchases and customer satisfaction. Which test should is use (pearson or spearman)? and what is the best graph to show the correlation between them. I did pearson first and used a scatter plot but that didn't seem the right choice since all the dots were not showing anything.
@@STEPHANYIIE1 Ah, a heatmap is what I would do then. Unfortunately this is a bit tricky with SPSS and requires additional Excel. I do have a video on that as well: ruclips.net/video/VieUWpWE1tY/видео.html. You might also be interested in my website at peterstatistics.com/CrashCourse/3-TwoVarUnpair/OrdOrd/OrdOrd0.html and peterstatistics.com/CrashCourse/4-TwoVarPair/OrdOrd/OrdOrdPair0.html as a start. They each have a menu on the left to go over, and include videos for SPSS.
@@stikpet Thank you!!!
No problem. Good luck with the analysis
I'm trying to hide legend on stacked bar, is there a way to make the percentage and the name of the variable shows up in the stack bar chart?.. I'm trying to make the name of the variables shows up before the percentage
In the chart editor (the window you get if you double click on the chart in the output) you can adjust many things. In the chart editor if you click on options you can opt for 'Hide Legend' The label of the categories is already by default as the horizontal x-axis title and the ordinal variable label above the legend. Not sure with what you mean by 'making the name show up before the percentage'. Do you mean in each bar for each option showing the percentage and name? If so you can use from the menubar in the chart editor 'Elements - Show Data Labels' and then in the properties window (ctrl+T if it is not showing) at the Data Value Labels tab adjust what you want to see . Hope this is what you were looking for.
@@stikpet thank you for your reply
is there a way to show the exact amount of the percentage?
I assume you mean to show the percentage values as numbers in the bars. The exact amount is often a fraction or an infine number of decimals.
If so you can use from the menubar in the chart editor 'Elements - Show Data Labels' and then in the properties window (ctrl+T if it is not showing) at the Data Value Labels tab adjust what you want to see. Hope this is what you were looking for.
@@stikpet Big thanks!
you're welcome. Good luck with your research/analysis/study
Hi I am just trying again n again and it is showing 100 percent values by default. Do you have any idea why happening so?
difficult to say without seeing. An obvious one would be in the screen at 01:01 in the video, make sure at 'Bar respresents' the option of 'N of cases' is ticked.
Another idea could be that you simply have 100 cases, so then it will show up to 100.
Otherwise I would have to do some digging of my own. Which version of SPSS are you using?
@@stikpet So basically I came here through this link of your video: ruclips.net/video/djBtLpW0Bvk/видео.html
I have tried like 15 times, followed the same procedure that described in the link I attached and its just same. Spss 20
@@stikpet Jeez! Do you have like an official email, I can send you the video. Yeah that's too direct, I am sorry for that but actually I have a limited time and I am just stuck.
so the other video is if you want one stacked bar for each variable, and this one is if you want a stacked bar for each category in another. If you can send me a screenshot of how you filled out the windows and the result, I can still take a look in the next few hours, and if that doesn't help send me the spss data file then I have a look tomorrow (hopefully that's soon enough for you). My email is stikpet @ gmail .com (without the spaces of course).
@@stikpet Hey, just sent you the email, please let me know if you've recieved it. Thank you
Data survey year?
You mean the year this survey was held? I think about 10 years ago or something.
@@stikpet ok
Actually my assignment data is on survey 1975.And I use it to do graphs on spss.
@@maryumzulfiqar9157 SPSS doesn't care how old the data is :-)
@@stikpet ok thankyou