Linear mixed effect models in Jamovi | 1 | Introduction

HTML-код
- Опубликовано: 15 июл 2024
- In this video, I will demonstrate how to fit a linear mixed effect model.
I will discuss:
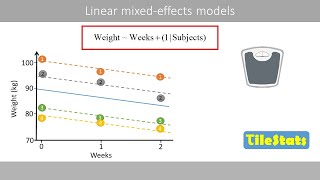
What is a mixed effect model?
Fixed effects
Random effects: grouping or clustering factor
The intercept
The slope
Organizing data
Model fitting and model comparison: AIC, BIC, LL
Checking the assumptions
Variance components: variance and mean
Intra-class correlation (ICC)


Thanks. The clearest walk through I've seen. I'm code averse; so I like Jamovi. I'll watch the second video and then comment on how my data came out.
Many thanks dear Vahid for your very nice explanations. Can you please also explain how to do Multilevel Mixed-Model Linear Regressions in SPSS? Not the basics, but the ADVANCED parts of it.
When we go depeer in this rabbit hole of mixed models, it becomes exponentially more and more confusing. Especially when wanting to select the random and fixed effects (as well as other components) in a complicated, unbalanced MULTILEVEL design involving different levels of repeated measurements (for example, nested within subject, nested over time, nested over category, all at the same time).
I see SPSS has some options that Jamovi or JASP don't (perhaps lme4 has, but R code is not at all easy to comprehend for a non-statisitcian). For example, SPSS receives both Subject ID and Repeated Measurements, and does so separately. And this too is another source of confusion, because I see some people treat the inserted "repeated measurement" as a FIXED effect, which is very strange because it is "repeated"! (should't it be designated as a random effect?!). Overall, Mixed is very confusing on so many levels.
So it would be very good to use SPSS for educating the ADVANCED parts of difficult mixed-effects models with multiple levels of nesting. Besides, to be honest, the GUI of SPSS is confusing at many points (and its Help is very bad), so many people would appreciate a good explanation of its different GUI items, buttons, options, etc.
Looking forward to your upcoming good lectures on advanced mixed models (preferably is SPSS). If you want me, I can give my confusing cases as examples to solve🤩😅🤭🙃🙈😁 . Thanks a lot in advance.