Denoising Data with FFT [Python]

HTML-код
- Опубликовано: 1 фев 2025
- This video describes how to clean data with the Fast Fourier Transform (FFT) in Python.
Book Website: databookuw.com
Book PDF: databookuw.com/...
These lectures follow Chapter 2 from:
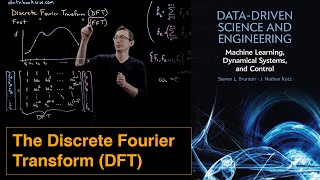
"Data-Driven Science and Engineering: Machine Learning, Dynamical Systems, and Control" by Brunton and Kutz
Amazon: www.amazon.com...
Brunton Website: eigensteve.com
This video was produced at the University of Washington
![Computing Derivatives with FFT [Matlab]](http://i.ytimg.com/vi/BCexJ-yfdi8/mqdefault.jpg)
![Computing Derivatives with FFT [Matlab]](/img/tr.png)


the way this video is setup, overlaying him, the code and a whiteboard, is really slick
Dude this guy is crazy, I still cant believe these videos are free.Thank You for making it free means a lot.❤️
I havent even watched the video yet and I can tell Im on for a ride. The content looks so good.
I can't even believe these videos are made
I've spent many hours trying to apply FFT to my data and I've finally done it with your amazing explanation. For sure, the best Fourier Transform video.
Pure gold. Fourier analysis still feels a bit like voodoo to me as I'm just learning the basics, and your videos have been very helpful. The python examples are really handy. Thanks for taking the time to do these things in both MatLab and Python.
Steve Brunton, I may never meet you in person but you helped me a lot with these videos. I wish you a good health and a prosper life.
People like you make the world a better place. Free education helps everybody in the end. Thank you.
This has been very useful for me. I am a Mechanical Engineer and I am working in dynamic studies of steel structures. This method is very practical to apply to the acquisition of accelerometer data in dynamic tests. Thank you so much Steve!!!
Brilliant. Just brilliant. The quality of this lecture is off the charts.
Hi Steve, I watched many of your videos in Control the comments there are disable so I took this opportunity just to say thank you
me too
Professor Brunton, I love all your videos.
This is so excellent. Absolutely the best, and most comprehensive video regarding real world FFT on youtube. Probably going to buy your book now. Thanks a lot!
Wow, thanks!
one of the best channels I could've ever stumbled upon...immediately subscribed😅
this is mind-boggling-ly useful! (written after hours of scrolling in vain attempting to understand both the transform itself and the code that implements it .) Thank you!
I was watching you when I was in college for controls, life has brought us back together lol
super-duper, as always. Python examples are what we need!
Thanks for such great videos! Been following you for years and I’ve learned so much and am truly inspired by your work. Just ordered the book and am excited to apply!
This is amazing! I am finally getting rid of the feeling that the topic is complicated thanks for these videos! I mean it is, but I also am capable of getting it with your explanation.
Your videos are crystal clear! I cant thank enough for sharing this high quality content. Loved the approach you took of writing parallel to the code!
Wow, I am super impressed, why didn't I find this channel early. Thanks so much for sharing this valuable information.
Very nice video professor Brunton. I think the idea behind is FOurier transform of white noise is a constant depending its amplitude. So for large signal-to-noise ratio , you will see a plateu + the real signal, then picking those peaks will work.
One of the best explanation I have ever seen ❤️❤️
Thanks very much! This really helps students who are struggling with denoising.
I told my self lets see what this guy is talking about...
Realized I discovered a wizard. I will have to see all your videos. I always was afraid from fft. Thank you for simplifying it. Thanks again.
I had Steven Brunton as a professor at University of Washington in Applied Mathematics, and he was excellent. So glad I just stumbled upon his channel. It looks really good. Will be tuning in! I am hoping you will do a video on linear programming and optimization; I have a problem at work I want to apply this to. :)
Awesome, thanks Joe! I have some optimization videos in the works, so stay tuned!
Amazing Prof. Brunton. These videos are extremely helpful for DPS researchers
Hello Steve, I just wanted to say thank you. It's been really helpful.
Very good explanation. GG for the backwards writing, REALLY nice.
Many thanks!
just in love with the way u teach concepts
Beautifully explained ! Wonderful to learn from Steve !!
Every body's a gangsta until a man with glasses enters the room and explains fft
For those wondering how to filter non stationary series, you can use overlapping windows to perform the same process per window then blend the signals in the overlapping regions
Very helpful content. I have used MATLAB but not python. I want to use FFT and some basic signal processing techniques to learn how to use python, so these videos are very helpful
I gotta say, watching these and re-remembering uni courses has been quite a blast. Thanks for your lectures!
Also, what exactly do you use to make these videos? I assume you write on glass and then flip the video? It always turns out surprisingly clean, with the screen projection as well...
Thanks! Yep, glass and flip.
Take note: f is the noisy data
1. f_hat = FFT(f)
- f_hat is a vector of complex Fourier coefficients (increasing frequency: low to high) with its magnitude.
2. PSD = |f_hat|
- vector of real magnitude (power) for each frequency.
3. Filter: on PSD, keep the power > Threshold, and set 0 to the rest (because they are the noise frequency) and we have new f_hat.
4. f_denoised = iFFT(new f_hat)
Thanks a lot again Prof! Just wanted to mention that, when calculating the power spectrum (PSD), the data type of the production result of complex number with its conjugate is actually: complex with 0j (Python3)
A fantastic video with great informational content...and mindblowing production!!! How do you do all the overlays???
Your lecture gives insight to the content what is in there books.
Thank you very much Prof. Brunton for the interesting video! It is amazing this way of making videos. Which software and devices do you use for that? Is that a glass board? or something similar?
Yes, a glass board
@@Eigensteve and yet the writing isn't back-to-front... clever! 🤔
Effective! Your amplitude at per unit time teaching is above threshold.
Great application of the convolution theorem. Well explained.
Thank you a lot, Steve! Your lectures are absolutely amazing and extremely helpful!!
The magnitudes of the signals with 50 and 120 Hz depends on the random numbers that you generate at the beginning of the code. I had this problem that my magnitudes where different from those presented in this video.
You forgot to multiply your np.fft.fft(...) output by dt. np.fft module assumes the sampling spacing is 1. So we have to fix for this if we have a different sampling spacing. Also, you don't have to give n as the second argument of your np.fft.fft because n is also the length of your signal, so it's effectless.
Thanks much Prof Brunton! This is gold.
thank you for the education kind sir!
math + code example is a great idea
this!
Steve, you are amazing. Thank you a 1000 times.
You are so very welcome!
These video series are worth more than the courses you spend thousands of dollars in a university
7:25 Start of the explanation on FFT filtering
Love your videos, I have a question tho. In the previous video Proffesor Brunton talked about how efficient the FFT was when our n was a power of 2. If I understand it correctly, here n = 1000? Why wouldnt we want n to be 1024?
i liked and subscribed before even starting the video.. i knew it was going to be great!
You are awesome, dude. Thanks a lot. I wish I had a professor like you at the college.
This is one of the best videos on how to apply FFT in Python!!! Thank you so much! Is it possible to make a video with Time Series data denoising? And could be applied directly on the original Time Series Data Or first we should obtain the difference on 1st grade?
Many many thanks professors this was very clear.
Thanks for showing us how useful is learning Math!! Amazing!!
Thank you very much for your amazing videos, but what about averaging to remove the Gaussian noise? (if the recordoing is long enough to perform several FFTs of course) It feels like a better method to remove noise since it can show information hidden below the noise floor that would otherwise be removed with the truncation method.
I ❤ FFTs. Thank you!
Thank you for making this video.
I have one question with making a threshold,
the threshold that you made, is subjective i thought.
Is there any non-subjective threshold method?
I mean, defined threshold to 100 isn't any valid reason..
(Sorry for my english)
Wow great content. Python example just boosted my interest in signals processing by many folds. Thanks a lot Mr. Steve, I really wish to see your behind the scene setup by the way :p
Thank you very much for this amazing video! I was struggling to understand this, but you made it look easy.
Would you consider doing a lecture on FFT in the context of NMR/Xray Crystallography/electron microscopy. Especially "Fourier Filtering"
Cool idea -- i'll add it to the list :)
Thank you very much Prof. Brunton for the interesting video!
Thanks for contributing! Exactly what I was looking for.
Love your presentation.
Interesting though that you got your code to work without errors.
Casting complex values to floats ist verboten! 😏 Here's how it should be for the graphs to display without error:
plt.plot(freq[L], np.absolute(PSD[L]), color='c', lw=2, label='Noisy')
However,
this does not solve the problem at it's root, because the Boolean return for a complex like `PSD` referenced to and integer as in:
indices = PSD > 100 does only return a Boolean array filled with `False`, unless np.absolute(PSD) gets implemented.
The best place to do this without undue repetition throughout the code is where the problem starts.
Here we see the amendment that forces absolutes and brings all the trouble caused by attempting to handle complex values like floats to an end:
PSD = np.absolute(fhat * np.conj(fhat) / n) # Power Spectrum Density (power of FFT)
However,
the error finds itself repeated in the last set of plots with the `Inverse FFT for filtered time signal` and is best corrected like this:
ffilt = np.absolute(np.fft.ifft(fhat)) # Inverse FFT for filtered time signal 😉
All in all, a very clear and understandable `toy example`. 💚
This video is amazing.. Just to the point !! I'm speechless on how good the video is.. ❤
thanks for great explanation! You guys are doing it on a different level :)
Thanks so much!
damn the video quality is amazing here. got a sub
Hi Steve, I have a doubt. If we run a Kalman filter on this data, can the filter distort / change the frequency content of the signal? I tried to run a Kalman filter and sometimes I get funny results. I am not able to understand what might be going wrong. Can you please help?
Thanks
That is a really good question. Yes, in general, filtering algorithms will change the spectrum of the signal, sometimes quite significantly. There is a lot of work in designing filters that have certain nice properties. For example, if we run a simple low-pass filter over the data, it will mess up the phase information in the signal (because there will be a small delay). So the 2nd order Butterworth filter is often used to prevent this phase corruption. Sometimes people also use the "filtfilt" function, which runs a forward and a backward pass of the filter to get rid of the phase delay. So long way of saying that yes, this is a real concern and it is not always easy to filter and preserve frequency content. But, remember, often when you filter, your goal is to modify the frequency content, for example to remove high-frequency noise. So there is no "silver bullet" for filtering.
@@Eigensteve I'm using the filtfilt in sensor live data and that technic doesn't work for live data since I'm seeing a kind of "repaint" after I receive the last point on the data received previously. Let's say that I have 50 points ... when I receive the point 51 what was calculated on the previous 50 points will change when I receive this last point, so the filtfilt technic doesn't work well on the last point received. Another issue is when I compare the live output of my Butterworth filter to filtfilt output they are exactly the same on the last received data, meaning that the delay is there on the last point received, the delay is only taken away for that particular "event"(Let's point 50) when we receive more data( >=51 points). Can you advise me any technic that allow me to filter data in live stream having no or very few delay? My data is not periodic, I think that for example the FFT is not an option. Thanks you.
@@Daniel88santos Applying FFT on live data sets, the size of which are not power-of-2? And then you're also filtering and inverse-transforming? Brave, yet interesting. My own power-of-2-cents would be... Don't allow the dataset to be sized dynamically. Keep a fixed size and let the live data "roll" through it. Make sure the size of this dataset is something like 64 instead of 50 or 51. Zero-pad if you must. If none of what I just advised made any sense to you, you may have to do a bit more research. Fourier Analysis and noise filtering is not a subject mastered with a few youtube videos.
@@romanvereb7144 thanks by you reply, I've figure out how to do it with any size of points, and not using zero padding ... but I cannot comment on it, since is proprietary technology.
@@Daniel88santos Such is the way of the world... One learns without giving back. A seed planted, but no longer spread.
This lecture is very clean and precise. But I need to do this in matlab and I am really getting confused on how to implement the index vector and multiplying it from the noisy signal
This video is adorably stylish!
Thank you for the enlightening video. In order to calculate the PSD you have to use the prefactor 2/n**2, i.e. PSD = 2 * fhat * np.conj(fhat) /n**2, right?
This work really helps, Sir!
Thank you for your videos
Glad to hear that!
Great lecture prof but I have one doubt. How to compute the x axis of the plot for any given data
thank you very much, you're a really good teacher!!
Thanks for the explain, it is very details and easy to understand. One question, how can we demonstrate/apply the 95% significant test onto the plot? Thanks!
epic lighting. subscribed.
Thanks for your videos Steve.
Thank you teacher for the awesome explanation!
Thank you for the clean explanation
Thanks for the nice Video. Ive got a small question. The decision where we make our threshold is made by the frequency-psd plot. Before we neglect the entry with the frequency of zero. Can this have an impact?
Thank you so much sir ,i was really confused before this video
To go further, it would be interesting to have a method to determine the threshold for PSD that we keep. In your case, it’s obvious that there are only two frequencies but what kind of methodology will you recommand if there no clear contrast between noise and real
Frequency ( would a simple
Normal t’est be sufficient?)?
I have a silly question. Is it the correlation among the data that yields two spike in frequencies in power spectrum? because the white noise is uncorrelated.
The power spectral density and the autocorrelation are very closely related. It turns out that they are Fourier transform pairs. So it is definitely related.
@@Eigensteve makes sense. thanks
First I liked, then I watched. Amazing!
0:50 you meant to say second per sample right since it's increment in time?
Thanks Steve for your knowledge.
what a great instructor! Thanks!
Agreed. A wealth of knowledge.
Thanks alot sir! I want to ask if the Fourier transformation adoptable to time-series data with trends?
Yes, THIS IS WHAT I WAS LOOKING FOR
THANK YOU RUclips ALGORITHM
Maybe a bit late to comment this, but when explaining the generation of the signal, "dt" is not the number of samples/second, but the number of seconds/sample, right? otherwise you would not have the first plot with that many samples in the time interval of 1s.
Can I also use this to get the phases and amplitudes of the waves that compose my signal?
You just made my day. THANKS :)
I'm glad!
Hi
Thank you for this tutorial.
Do you know if it is a signal with phase/shift, how to inverse it?
When calculating magnitude, we don't have phase info.
Thank you
Great video - thank you, very helpful. Just curious to determine whether or not there is a way to computer a PSD minimum. You selected 100, but that was after observing the graphed data. Is there a statistical approach to computer this value?
Just take PSD max and set a threshold of 90% of it to filter-out lower frequencies.
Thanks a lot . this was great. but how do you do this on images?
Thanks for your amazing videos and book. I'm watching them all, and I hope they'll help me with a Kaggle competition on detection of gravitational waves from time series obtained by LIGO and Virgo.
What are the units for the Y-axis 'power' and what determines its scale? How does the input signal correlate to the float64 output of the 'FFT'?
Amazing lecturer!
Pls I want to purchase your book, do I need to purchase both vol1 and vol2, or the vol2 is the second edition of volume 1?
No that is just the 2nd edition, so no need to buy both
This seems like it could be used in a unit test to test that the FFT function in an application is working. Will the filtered data be exactly the same as the data that was used to create the noisy data?
Perhaps, but I think there might be more quantitatively exact unit tests for the FFT. The filtered data will only approximate the original data, so the agreement won't be that close quantitatively. If I was cooking up some unit tests off the top of my head, I would probably run through a few pure-tone sine waves, a few two-tone waves, etc. I would also check that Parseval's theorem is being satisfied.
@@Eigensteve Yes, of course the filtered data are just an approximation of the original one. Thank so much my Dear professor for the deployed effort, and Thank you for sharing, you are the best professor of Fourier Transform that I have never seen. Little thought of the teacher Nathan Kutz and to all your team.