Это видео недоступно.
Сожалеем об этом.
Difficult network diagram example with lag solved

HTML-код
- Опубликовано: 19 авг 2024
- Check out www.engineer4fr... for more free engineering tutorials and math lessons!
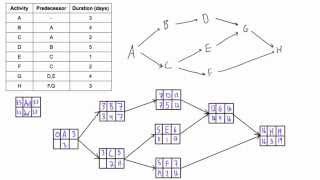
Project Management Tutorial: Difficult network diagram example with lag solved.
Please support my work:
PATREON | / engineer4free
Every dollar is seriously appreciated and enables me to continue making more tutorials


Hello, I can't describe how much this video has helped me with studying for my masters in PM. I was so lost while trying to figure out what's in the lectures as there's no explanation. I am really glad I found this video! thanks a lot
Glad to hear it! Plenty more PM videos on the channel, or also engineer4free.com/project-management ☺️
Hey man, I'm a software engineer by profession and I totally needed this for my work. Know that you are being appreciated from halfway across the world. Lots of love from India!
That's awesome, I'm glad to hear it helped, and thanks a lot for the really kind words!!!
That moment when you get the PDM structure from a video better than the noted one from your professor's seminar. Here take my like bro! cheers for the tutorial :D
Thanks for this comment bro, cheers!!
I was watching your video as I was preparing for my PM final today. Yep my professor was mean enough to get us a similar complicated network and yep I totally nailed that shit! Many thanks!
hahaha word, always expect and be prepared for the worst... glad this video helped you crush it!!
hahahaha !!!! SO DAMMMMMNNNNNNN TTTTTRRRUUUUEEEEE !!!!!!
@@skanderhaffar6958 I'm going to accomplish that feat tomorrow. Wish me luck! :)
Man I'm in Uni studying Civil Engineering with a mid coming up in two days and not alot of time to understand this video greatly helped especially the gant chart the professor never used it your a lifesaver I truly wish you happiness in life. Lots of Love From Jordan
My professor expects us to know all these just by reading the book. We don't do exercises in class, we don't practice at all. Your videos have helped me a lot! I am currently studying the Masters in Project Management. YOU ARE AWESOMEEEE :) !! Thanks a lot!
Thanks for the awesome comment Febe!!! Glad I can help =)
pretty easy now to understand actually, took me half the video to realise what was happening, but now it all makes perfect sense! thanks a ton man!
haha yeah these ones are weird, but very likely to show up on exams because of their weirdness. Glad you like it, it's video #22 out of 46, do check out the rest at engineer4free.com/project-management or just the youtube playlist ruclips.net/p/PLOAuB8dR35oeyKU0ojIxD8Muf6Mwc8ugW =)
I have my engineering project management exam today and this video has helped me finally understand how to compute forward and backward passes with various relationships and lag. Thank you so much!
+Joshua Niranjan That's awesome!!! Thanks for letting me know, I always like to hear success stories :)
Fantastic, because my lecturer has made really difficult lagging problems for both the gantt charts and for the critical path method. This has helped heaps thank. Love your channel.
Thanks for sharing it. I watched to multiple times to understand however it clears my doubt about FS, SS, SF, FF
Awesome glad to hear it!! If you want some more detailed videos on FS, SS, SF, FF then check out videos 16 - 22 here: engineer4free.com/project-management =) =)
I really like your teaching approach. And thank you for breaking down this into simpler forms. I found you when I study for a construction and scheduling class.
Been studying for the Project+ cert. Your videos have been very helpful. They're presented clearly and concisely using simple terms. Your descriptions gave me several 'ah ha' moments. Thanks!
Tom Pope That's awesome to hear! You can find all of the PM videos that I made here: engineer4free.com/project-management Good luck on your certification!
Thank you!!!! My scheduling professor is HORRIBLE lol........ive been lost for a couple weeks and your 12min. vid just answered all my questions...why did I not check youtube sooner lol
Haha, sorry to hear that Alex but glad I can help =)
You are my savior man! There is a hope to pass the exam now! Thanks a lot
Thanks Eleni, hope the exam goes well!!
Lol. . Engineer4free always do the best
Believe it or not, our teacher has written the same question on her pamphlet for us, thank u so much
My life is complete today... Such a beauty you are.
Thanks Aamir! Check out engineer4free.com/project-management and you're life will be even more complete =)
Definitely. I've already subscribed to this channel. Hope to see great content in future too.
great. your make for me clarity for that I missed the one class and more than that.
you are a brilliant teacher
Excellent video, from an excellent channel. Thank you very much!
Thanks Kareem!! =)
Having my Exam next week thank you for saving me
Thankyou 🙌 from india.
thank very much ,now i can solve the network diagram
Mission accomplished! The full playlist can be found at engineer4free.com/project-management if you're interested in checking it out!
I was searching for this type of example thanks dude
thanks for uploading this! it made me understand pdm which i have been struggling for days!!
Happy that I was able to help!
Very helpful in my school work... Can you please do a video on Line of balance control, please tag me on one if was already uploaded
7:37 I don't understand the last activity H the relation is SF we should tack the ES of activity F its 3
+2 lag its 5 and for activity G we should tack the ES its 7 +2 lag its 9 so we tack 9 in Forword not 11 and the CPM will become ABDGH
thank you very much.love from sri lanka.
❤️❤️
this guy worth a million like
Thanks Faran!!!
Excellent Job
My best by far. I also have an unrealistic problem to deal with
Such is the life. Thanks for watching!!
Thanks very much for the video. It was quite educative.
Hey you're welcome, thanks for watching =)
My teacher is juse mean like this. Thank you for the video.
you are the best, thank you
You made it look so simple .
Thanks, hope you found it helpful
thank you. it is very clear
Thanks for the great tutorial!
In this diagram, we have 3 paths in total. They are (i) A-B-D-G-H, (ii) A-C-E-G-H, (iii) A-C-F-H
If there were no lags, we could just add up all the durations of all activities in a single path to get the critical path (project duration).
Now, is there any way to get the critical path by adding up the duration of the activities and ± lag?
Kind regards.
No, it is not that if there is no lag we simply add all the activities to get critical path and duration of project.
We must follow the pattern of network diagram and work accordingly with it to get critical path and total project duration. And type of relationship given to activity must be taken in consideration.
@@tarashankarsharma3372 I see. I tried an AOA network for a different table whlch helped me understand the concept more. Thanks for your reply. Have a great day!
Thanks for all the good questions and answers to both of you 😊
ruclips.net/video/qeKKW6-R-UU/видео.html
Can you please subscribe my channel.
Nice explanation
You are a life saver. THANK YOU!!!!!
Thank you so much. Your explanation was vivid & clear.
+Fachri Eri Reza Thanks for the feedback! You can check out all 45 PM tutorials I made here: www.engineer4free.com/project-management.html :)
Thank you very much.really helpful and great explanation.
You're welcome!!
Thanks for the help! Really appreciate it!
You're welcome!! 🙂
Thank you brother, it really helped me to pass my midterm 👍🏻
Glad t hear it! Thanks for watching and commenting :)
You are a life saver!!! Thanks🧡
Happy to help 🙂🙂
Awesome, please upload for LEAD relationship as well
Thanks for the suggestion
Thank you so much, that was so helpful
Glad to hear it!! The full playlist is here too: engineer4free.com/project-management =)
THANKYOU, SO MUCH FOR THIS LECTURE
You're welcome Dheeraj! =)
Thank you for sharing with us. I really priciate that
Glad you like it, thanks for watching!!
Thank you
So clear. Thank you!
You're welcome!!! (=
Thanks
Great Video, I got same kind of question in my examination and I nailed it . Thanks (Y)
+Sohaib Iqbal Glad to hear it, that's awesome!!!!
Your the best mate
Well done Man .. appreciated
Well explained!
Great Videos, very helpful. How would the total and free float be calculated when there is lag and also where the are finish to finish relationships? Thanks
Did you get the answer for your question please, if you did, can you share it.
Thank you.
Very Very helpful! Thank you so much:)
I'm still struggling with the backwards pass!! We saw one small example in a copy, no actual drawn out example and we have to do a 32 length activity with FS and SS events.
Hey Sean, I recommend taking a step back then. Definitely watch videos 4-9 here: engineer4free.com/project-management and if you have time (like 2 hours or so) then I recommend just watching everything up to the video that we're commenting on (which is video 22). Going through them all will fill you in with bits of insight here and there and will just get you some more practice to get comfortable with the topic. Cheers let me know how your progress goes!
you, sir, are my savior. thanks!
Glad I can help! :)
thanks man
excellent sir. it's. tricky bt totally correct.
thanks sir
great solution.
Thanks Lalit.
PERFECT !
Thanks!! 😊
and I did have that type of teacher....thanks for your video, this is very tricky stuff
+Zakiya Mitchell haha glad to hear it's helping! You can check out the rest of my PM tutorials here: www.engineer4free.com/project-management
Thanks sir
You're welcome Abdo!
working backward, is there a method of reading the gant chart to get the values or a formula to quickly and with less effort get them values?
You can only read the ES and EF values off the Gantt chart. The numbers that each activity on the Gantt chart start and stop on are the ES and EF values. You could use them to populate the network diagram and skip the forward pass, but you will still need to do the backward pass. I recommend drawing the gantt chart and network diagram, and doing the actual forward pass, and then quickly checking the ES/EF values against the gantt chart to make sure that it looks like you have no errors. That's more valuable to you then using then using the Gantt chart to skip a step.
Ohhh thank you so much now i get it have exam tomorrow!
Awesome, hope it went well!!!
Life saver❤️
❤️
Please C A(SS).
Seriously though, great videos.
awesome video. Thanks man
Thanks for the video man!
Thank you for the videos on precedence notation diagram! it is very helpful for students like me as it is very clear!
But, may I ask what will you do in this situation.
There are 2 activities e.g. activity A and B, and they have the same successor, activity M. A have FF relationship with M while B have normal FS relationship with M, but B to M (FS relationship) has a larger value of ES than A to M (FF relationship).
Which value will you choose in this case?
+Rita Indah Lestari In that case, the duration of A, B, and M are all significant too. For the A-M relationship, you can first find the EF of M, then subtract the duration to find the ES of M. Then you need to check the B-M relationship. You can first find the ES of M based on E. You would then compare the ES of M given by A and then also as given by B, and chose the larger value. You must chose the larger value in the forward pass because in order to satisfy both predecessors. As you can see, the logic AND the durations of all activities in question would affect the outcome. Hope that helps!
Sir, if G depends on D but on the pert diagram G starts before D finishes so it doesn't depend on D.
Is the Gantt chart plotted for activity E correct? It says E can start 3 days after C finishes with a duration of 1. So if C finishes on day 3, E should be be plotted on day 4? Right?
Please inform how to calculate FS-2 or say SS-3 in PDM network calculations for CPM
See videos 16-22 here: engineer4free.com/project-management =)
Thank you. Very helpful
Glad to help :)
hay man You are a save my life thanks a lot sr 0_0 love you so much keep it up !
Glad I could help 🤜🤛
Loved it !!!!!
Thanks, glad to hear it! =)
understandable videos great
Great video. Helped to solve one question for assignment.:)))
=)
Hi
I not clear on how critical path is determined manually from a network diagram with Lags/Leads. Without lags/Leads we understand the critical path is the longest path in the network diagram and each task/activity on the critical path has its Start of Activity (LS-ES=0) and Finish of Activity (LF-EF=0) in short no slack at all. In addition, we can also add the individual duration of activities in the critical path to get the EF of the project.
Now how do we use this same principle on a network diagram with lags/leads to determine the critical path? Lets take your example above - based on this diagram you have three paths (i) A-B-D-G-H, (ii) A-C-E-G-H, (iii) A-C-F-H. Out of these three the only path that have the Start of Activity (LS-ES=0) and Finish of Activity (LF-EF=0) is A-B-D-G-H and if we add the duration of these activities it gives a total of 16 but the EF of the last activity shows 14...so this shows we cannot apply the same approach to determine the critical path as we do when there is no lags/leads.
Can you please let me know how the critical path is determined manually taking your example above.
Your input much appreciated.
Hi
I really like to know the answer to my query above. Appreciate if you or anyone can help with my doubt above regarding critical path? Basically, how you determine the critical path from a network diagram which has various types of dependencies and lags?
Best Rgds
Thanks
Thankyou
can there be two critical paths in a network?
Yes. If you find more than one, write them all down.
@@Engineer4Free okay thanks a lot sir :)
really useful
It becomes something else to move from the gantt chart to the activity table. My lecturer just frustrated us with such as you turn to see weird pertchart...
Great to solve with you.
Glad you liked it :)
Useful one
Hi there, what is the difference between Critical path method and Arrow diagram?
Hi, sorry for any confusion brought about by the naming of each style of diagram. There are two types of network diagrams: Activity on Node (AON) and Activity on Arrow (AOA). In these videos I usually refer to AON as PDM, and AOA as CPM. That's local lingo for me that I originally learned, but you are actually better to use AON and AOA, it's more clear.
@@Engineer4Free Thanks for the clarification
Hi, for this example. is there ways to calculate Total Float and Free Float?
Thank you
thank you
Thanks for watching!
This is easier that the question the doctor gave to us in the assignment -_-
helpful . a lot!
I have a scenario wherein an merge activity node has got both FS of 5 days lag and SF of 20 days lags. How to make a network diagram for the same, Please could you post a video on the same.
We need more like how to find a Total float, free float, independent float, interfering float.
I've just got a few videos on float, they are videos 13-15 here: engineer4free.com/project-management
thanks
your welcome!
Which tool you are using to draw the diagrams?
I've got a list of all the hardware and software here: engineer4free.com/tools =)
hello, I'm a masters student and i want to understand the concept of free float in the examples where lag is in picture i would be glad if you can help me out in regard to this. Thank u
good presentation
Thanks!
but why is it that the ES of each first activity in a CPM is a 0?
Watch video #1 here: engineer4free.com/project-management . The 0 comes from the way that I draw Gantt charts, and gets directly translated into the way that I draw network diagrams. In that video you will notice that 0 represents the beginning of day one. 1 represents the end of day one and also the beginning of day two. 2 represents the end of day two, but also the beginning of day three, and so on. In that video, you can see this pattern, because activity A ends at 2 which is clearly the end of the second day, but activity B starts also at 2, but is the beginning of the third day. In a network diagram, the EF of A would be 2, and the ES of B would be 2. The same logic applies to why activity A stars at 0, not 1. Does that help?
Ironicly enough my teacher is using this to teach economics.
I wish I got a teacher's salary to play other peoples RUclips videos🤔
@@Engineer4Free :( our professor literally gave an exam based on 2 of your videos and istg I just discovered this channel 😭😭😭! :( these videos are amazing though, much better than what my professor teaches!!
@@kittywitty5046 glad my videos are helping you, and your professor 😅
@@Engineer4Free 🥺❤️ TYSM again! 😭❤️
I'm confused. Shouldn't the EF= ES + duration - 1? If your activity, say B, starts on day 5 and lasts for two days- the team works on days 5 and 6. So the finish day should be day 6, not day 7. Can you please explain your approach. It was a good brain teaser, by the way. Thanks!
sagittariansrock Hey I see what's confusing you. Take a look at the numbering for the days on the x axis. I have labelled it from 0 to 14. The 0 represents the start of day one. The 1 represents the end of day one, and also the beginning of day two. The 2 represents the end of day two, and also the beginning of day three and so on. Take a look at Activities E and F first for example. We generally assume that people work regular hours, so like 8am-5pm. So first, the 3 on the x axis represents the end of day three (lets say 5pm - the end of the working day) and you can see this is where activity E wraps up (activity E is one day long so it starts at 8am and ends at 5pm on a single day). Activity F starts right on the line for 3 but its not going to start at 5pm and work through the night. Activity F will start at 8am the next morning, so the 3 on the x axis also represents the beginning of day four. I like to only think of the numbers on the axis as the ends of days (when I look at the 3 the first thing that comes to my head is that 3 on the x axis represents the end of day 3). Another way to wrap your head around it is to acknowledge that the columns that form vertically are single days. The space between 2 and 3 on the x axis represents day 3, as seen by how activity E fits only between 2 and 3 and is one day long. To go back to your original question, take a closer look at the Gantt chart. Activity B is actually being performed during days six and seven. Even though it starts on the 5 and ends on the 7, you should now be able to see that that means it starts at the beginning of day six and goes until the end of day 7, which is two days in duration. I hope this helps, let me know if you still have questions because it can be a bit confusing to first wrap your head around the labeling.
Engineer4Free I got it now. It seems that there are two parallel but equally accurate ways to depict this, and I have been using the start on day 1, add duration - 1 system for my exam. Thanks for the very clear explanation :)
Will these kind of questions come up in PMP exam?