Размер видео: 1280 X 720853 X 480640 X 360
Показать панель управления
Автовоспроизведение
Автоповтор
really nice tip! I enjoyed this a lot, thanks!
Thank you for the excellent video! Super useful!
Thanks for your feedback!
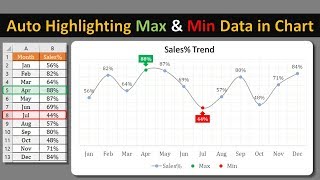
Really great trick to apply conditional formatting on an excel chart!👍Awesome Dilip☺
Thanks! Please share.
Excellent bro, got what exactly what i am searching for ... Thanks a lot
Absolute genius, super elegant mate!
do you know why I cannot mark all 3 text fields?
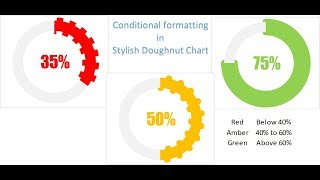
How do I create a donut using conditional formatting from a pivot table?I create a pivot table with a rule Green>75%, yellow 50%-75%, red
My excel sheet won't select all my data. It only selects red & difference & two formulas
Please download the sample file from the link provided in the description box to check what is missing in your file. Thanks!


really nice tip! I enjoyed this a lot, thanks!
Thank you for the excellent video! Super useful!
Thanks for your feedback!
Really great trick to apply conditional formatting on an excel chart!👍
Awesome Dilip☺
Thanks! Please share.
Thanks! Please share.
Excellent bro, got what exactly what i am searching for ... Thanks a lot
Absolute genius, super elegant mate!
do you know why I cannot mark all 3 text fields?
How do I create a donut using conditional formatting from a pivot table?
I create a pivot table with a rule Green>75%, yellow 50%-75%, red
My excel sheet won't select all my data. It only selects red & difference & two formulas
Please download the sample file from the link provided in the description box to check what is missing in your file. Thanks!