Excel Doughnut Chart - Conditional Formatting | FREE Download

HTML-код
- Опубликовано: 30 сен 2024
- Create this chart in a single click with our Add-In Pine BI:
➤ www.pinexl.com...
--
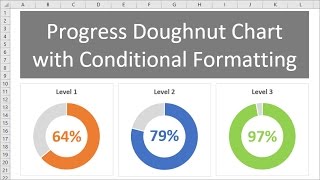
Learn how to create a Doughnut Chart in Excel with conditional formatting. Use it to improve data analysis and presentation, and to impress your viewers! No VBA or Macros needed. Perfect for Dynamic Dashboards!
➤ If you found this video useful, please Like, Share and Subscribe!
Need amazing Excel Dashboards and Charts? We've got you covered!
We can support you by updating your existing Spreadsheet visualizations or creating new, based on your data from scratch! For more information, visit our Services page:
➤ www.pinexl.com...
Check out our premium Excel Templates, including our KPI Dashboard Template featured in the video:
➤ www.pinexl.com...
Download for FREE - this Excel chart is available with instructions at:
➤ www.pinexl.com...
Follow us on:
➤ Facebook: / pinexl
➤ LinkedIn: / pinexl
Modern & Professional. No Macros. Completely Unlocked.
Music: www.bensound.com


![Doughnut Chart for Excel Dashboards: Simple and Easy way! [Excel Free Template]](/img/1.gif)
Thank you! and i have a question about the formula for MAX.
Can't i just subtract 'current progress' from 1? Isn't it the same with MAX(1,current_progress)-current_progress?
You can do that, but you have to be sure that the result won't exceed 100%. If it does, and you don't use the MAX formula, the result won't be displayed correctly, as the Max number will be negative. By using the MAX formula, we make sure that even if the actual result exceeds 100%, the chart is displayed correctly.
@@Pinexl AHHH I got it! Thank you very much for answering me very promptly :)))
Great tutorial, nice and clear and concise. Trouble is for me, using 365, doughnut charts were discontinued in Office 2016 in favour of starburst charts. Looks to be a similar process but having to figure out a few things.
Very useful!
Thank you!