Excel scenario manager

HTML-код
- Опубликовано: 15 июл 2024
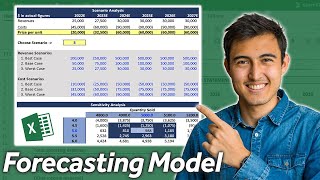
- Welcome to this tutorial on how to use scenario manager in Excel. In this Excel spreadsheet, we have some input variables here at the top, a profit and loss forecast right below it, and the target variable of Operating Margin at the bottom. This is a very simplified forecasting spreadsheet for a new product introduction. And as is the case with NPIs, there is a lot of uncertainty around key assumptions. Using scenario manager in Excel is one of the ways to quantify the relationship between input variables and target variables.
⏱️TIMESTAMPS⏱️
0:00 Scenario manager introduction
0:37 Scenario manager vs goal seek
1:16 Scenario manager vs data table
1:56 How to use Excel scenario manager
3:15 Adding a scenario
4:13 Showing a scenario in the spreadsheet
5:24 Scenario summary report
Scenario manager is found on the Data tab - What-if analysis. There are actually three options listed under What-if analysis: scenario manager, goal seek, and data table. I covered goal seek and data table in earlier videos:
Goal Seek in Excel • Goal seek in Excel
Sensitivity analysis in Excel (using data tables) • Sensitivity analysis i...
Using a data table is great when you want to see the effect on target variable Operating Margin of changing two input variables simultaneously. However, we cannot accommodate more than two variables into a data table in Excel. If we want to change all three input variables at the same time, we can use What-If Analysis - Scenario Manager.
Here’s how Excel #scenariomanager works. Select the input variables. In this spreadsheet, there are only three of them. If you need to, a scenario can contain up to 32 cells! Go to Data - #whatifanalysis - Scenario Manager: “Create different groups of values or scenarios, and switch between them”. When you start off, no scenarios are defined yet. Let’s add our first scenario called “Base Case”, where we simply store the current values of the input variables, so we can always go back to the base case if we need to.
Let’s go back to Scenario Manager, and add a scenario called “Low-Low-High” (low volume, low price, high variable cost per unit). For volume, we input 80 thousand units (lower than the base case). For price, $9 (lower than the base case). For variable cost per unit, $7 (higher than the base case).
Next, we add a scenario called “High-High-High”. Volume of 120 thousand units, price of $12, variable cost per unit $7.
Then, a scenario called “High-Low-Low”. Volume of 120 thousand units, price of $8, variable cost per unit of $5.
Now we can apply the magic of the Excel scenario manager. Click on the “Low-Low-High” scenario, and then click “Show”. The input variables from that scenario are now shown in the actual spreadsheet, and we see a negative Operating Margin of $40K in cell B11. The cool thing is that the data tables on the right have also been updated. If we don’t like the negative Operating Margin, then we need to get to at least a volume of 100 thousand units at a price of $9, or a price of $10 with 80 thousand units.
We can switch between showing and editing the various scenarios. Or we can restore the base case scenario, if that turns out to be the one we want to pursue after all.
At some point during the analysis, it might be useful to show what each scenario contains, side-by-side. That’s where the scenario manager summary comes in. We would like report type “scenario summary”, based on result cell B11. If we click OK, then a new tab is added to our workbook. It has the current spreadsheet input variable values in column D, and then the scenarios in column E through H. Row 6 puts the volumes side-by-side, row 7 price, row 8 variable cost per unit. Row 10 has the expected Operating Margin levels for each scenario, showing the large variations in Operating Margins when assumptions change. The note at the bottom is very important: values are represented at the time when the scenario summary report was created. Scenario summary reports do not automatically recalculate, so if you change something on the main worksheet, you will need to create a new summary report to see the latest data side-by-side.
I hope #Excel scenario manager will be useful for you for planning, analyzing and forecasting!
Philip de Vroe (The Finance Storyteller) aims to make accounting, finance and investing enjoyable and easier to understand. Learn the business and accounting vocabulary to join the conversation with your CEO at your company. Understand how financial statements work in order to make better investing decisions. Philip delivers #financetraining in various formats: RUclips videos, classroom sessions, webinars, and business simulations. Connect with me through Linked In!
Want to get access to bonus content, and/or express your gratitude by buying me a cup of tea? Join my channel as a member through / @thefinancestoryteller


Enjoyed this video? Then please subscribe to the channel, and watch the related video on sensitivity analysis using data tables next: ruclips.net/video/W791wTdTfbk/видео.html
Its purely satisfying to listen all your explanations! Its not only useful but it has the tricks I didnt know!!!
Glad to hear that! 😎
I love the way you kept things simple!
Thank you, Tiong! That is wonderful to hear.
Excellent presentation. I will view your other Excel videos. Thank you.
Thanks and welcome! 🙂
Thank you for all your efforts
My pleasure!
Good explanation bro, simple as it should be
Keep up the good work
Thank you, Marco! That's exactly what I was aiming for. Nice to hear that it worked. :-)
That’s great. Thank you
Glad you liked it! 🙂 Enjoying using Excel what-if!
Thank you so much
You're most welcome!
Awsome
Thank you! I agree. 🙂
Nice...
Thank you!
I don't know if I've looked properly or not, but I can't seem to find anything on control accounts, could you maybe make a video on control accounts, describing the basics and the purchase/sales control accounts?
I cover a bit of in the 2nd half of my video on suspense accounts: ruclips.net/video/7_CBmXcJE2Y/видео.html
@@TheFinanceStoryteller Alright, thank you!
Could you please send me a copy of this excel?
Hello! The Excel files that were used in my videos are available to channel members: ruclips.net/channel/UCQQJnyU8fALcOqqpyyIN4sgjoin
Hi, as I have already subscribed your channel and been a fan of you, how can I get the file :) thank you
Hello Hannah. Subscribing to a channel and becoming a member are two different things. See this video for explanation: ruclips.net/channel/UCQQJnyU8fALcOqqpyyIN4sgjoin
what is your accent
Dutch.... I am from the Netherlands.