Thank you so much 😊 For more updates download the app Android- snjim.courses.store/120798?Dcopy-link%26Dtutor-course-referral%26Dcourse-overview-app iOS-apps.apple.com/in/app/classplus/id1324522260 Contact us- +916398653804,8288894724
Thank you so much 😊 For more updates download the app Android- snjim.courses.store/120798?Dcopy-link%26Dtutor-course-referral%26Dcourse-overview-app iOS-apps.apple.com/in/app/classplus/id1324522260 Contact us- +916398653804,8288894724
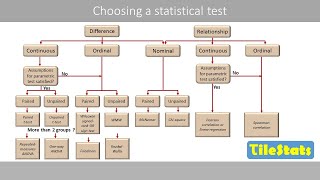
When you collect the data... Then you see the normality of the data... You put the data in the histogram to check the normality... Like if your data is presenting a bell shape, or no skewness is there then data us normally distributed... Otherwise if your data doesnt make a bell shape then data is not normally distributed... NOW, is data is normally distributed then use parametric tests otherwise use Non- Parametric tests...
Thank you so much 😊 For more updates download the app Android- snjim.courses.store/120798?Dcopy-link%26Dtutor-course-referral%26Dcourse-overview-app iOS-apps.apple.com/in/app/classplus/id1324522260 Contact us- +916398653804,8288894724
Hello, Go to the channel, there you will see many options in which click on playlist... Go to the playlist of the channel.. you will gwt all the videos...
Respected Mam, I have three independent variable and one dependent variable and i have to test significance of differences, kindly suggest which test is suitable ?
Thank you so much 😊 For more updates download the app Android- snjim.courses.store/120798?Dcopy-link%26Dtutor-course-referral%26Dcourse-overview-app iOS-apps.apple.com/in/app/classplus/id1324522260 Contact us- +916398653804,8288894724
What is a bell curve simple definition? A bell curve is a type of graph that is used to visualize the distribution of a set of chosen values across a specified group that tend to have a central, normal values, as peak with low and high extremes tapering off relatively symmetrically on either side.


Really... your teaching is very simple but understable.....and application based example.... thank you very much...God bless you
Thank you so much 😊
For more updates download the app
Android- snjim.courses.store/120798?Dcopy-link%26Dtutor-course-referral%26Dcourse-overview-app
iOS-apps.apple.com/in/app/classplus/id1324522260
Contact us- +916398653804,8288894724
Its a very nice explanation🙂 finally someone cleared my doubts😊
Pleasure...
Really all video are very knowledgeable 🙏🙏🙏
behad sandar video hai aapka research topic k upar... I am from Psychology Background
Thank you so much 😊
Best सबसे aacha importent सबसे easy🙏🙏🙏
Thanks for watching, and keep supporting us.
Great explanation...impressive
Glad you liked it
Very nice explanation...bless you
knowledgeable lesson
Nice explanation ma'am
Outstanding teaching mam
Thank you ma'am for explaining so well.
Yaa
Thankyou ma'am for this informatic concept
Thank you dear, keep supporting us
Plz make more videos on statistics
Best explanation 🙏🙏
Outstanding God bless you.
Nice 👍
Awesome lecture..
Ma'am ab test and measurements subject ko padaiiii
Well explained 👏
Thank you so much 😊
Nice explanation 🙏
Thank you so much 😊
For more updates download the app
Android- snjim.courses.store/120798?Dcopy-link%26Dtutor-course-referral%26Dcourse-overview-app
iOS-apps.apple.com/in/app/classplus/id1324522260
Contact us- +916398653804,8288894724
SPSS software and References tools ka video bnaye ma'am
Yes will try sir
Mam plz explain me the third point which is (data is not normally distributed)plz reply soon I'm waiting for your response
When you collect the data...
Then you see the normality of the data...
You put the data in the histogram to check the normality...
Like if your data is presenting a bell shape, or no skewness is there then data us normally distributed...
Otherwise if your data doesnt make a bell shape then data is not normally distributed...
NOW,
is data is normally distributed then use parametric tests otherwise use Non- Parametric tests...
Good
Nice video mam thanks
Thanks mam
Thank you so much 😊
For more updates download the app
Android- snjim.courses.store/120798?Dcopy-link%26Dtutor-course-referral%26Dcourse-overview-app
iOS-apps.apple.com/in/app/classplus/id1324522260
Contact us- +916398653804,8288894724
Ma'am what is npc that you have told in this video for choosing parametric test??
well explained
Nice lecture madem
Nyc
Yah video apne kaise banaya hai please give me answer
👍👍
I don't know Hindi plz explain in English 😒
For queries contact these numbers +91 93894 32207
+91 79865 60727
For more information join our telegram group
t.me/scholarsmantra
Plz of privious vedio
Hello,
Go to the channel, there you will see many options in which click on playlist...
Go to the playlist of the channel.. you will gwt all the videos...
Mam... Strongly disagree to strongly sgree 1 to 5 ma data ho agr.. To ye ordinl data h ya intervel???
Mostly it’s fall under the ordinal scale because it’s follow the order.
mam g ap ny NPC ka name liya kindly is k bary ma explain kr den
If data is interval or ratio but not normally distributed, should we use non parametric test then ?
Then we can use parametric test by increasing the sample size
Respected Mam, I have three independent variable and one dependent variable and i have to test significance of differences, kindly suggest which test is suitable ?
Great explanation 👌. Really helpful 👍..
But ma'am with due respect...
Severe:- it is pronounced as se-we-ar not se-v-re
Thank you mam
Thank you so much 😊
For more updates download the app
Android- snjim.courses.store/120798?Dcopy-link%26Dtutor-course-referral%26Dcourse-overview-app
iOS-apps.apple.com/in/app/classplus/id1324522260
Contact us- +916398653804,8288894724
What is npc
He'll mem
Mam nai hua data collection tools ka video
Hello amanpreet...
Call on the office number i will provide the data collection tool video personally...
+919665174724
Mam do you have english version
No this is the only video
Before Ancova , what are the steps like mean, standard deviation...
If you put data in SPSS it will give you mean and standard deviation and also give significant value between the group as well as within the group.
Mam what is bell curve
What is a bell curve simple definition?
A bell curve is a type of graph that is used to visualize the distribution of a set of chosen values across a specified group that tend to have a central, normal values, as peak with low and high extremes tapering off relatively symmetrically on either side.
Mam please explain me the Dankan's test
Hello mamta...
Ap ye bata dijiye apne ye test kaha pada hai...
Kis topic related hai
Aap 26 ki nahi ho 36 ki ho