thank you so much for the video! i have been watching a lot of vosviewer tutorial and this is the one that I actually find incredibly helpful. i like that you explain every feature of the software. i also really appreciate you for sharing your personal experience, it gives me a picture of how to use the results. keep it up!
Excellent video! Thank you! I am new to VosViewer and was stuck. This video helped me to get unstuck! I plan to watch all your previous videos. And, by the way, I love Dimensions! Again, thank you, and keep up the good work!
Hi in your paper titled "A review of green supply chain management: From bibliometric analysis to a conceptual framework and future research directions" how did you create figure 6? Can you please guide me about it ?
hi, we created figure 6 manually. We first checked in the reviewed studies which associations were found statistcially significant at 5%. Those were mapped in a excel file. Then the figure 6 was created manually in excel. doi.org/10.1016/j.resconrec.2018.08.004
@researchhub I went through almost all of your freely available videos regarding biblometric analysis but I still need your guidance in problem statement definition (limitations etc)fr my review paper and theoratical framework.I need your paid guidance for that can you tell me how to communicate with u? I have Scopus login but I can't access web of science:(
Can you also use Vos viewer for keyword-context analysis for .txt files without abstract? Not scientifical articles just reports/texts that you upload yourself?
Many thanks for the video. You mentioned about review paper using bibliometric analysis. I opened the four articles in the description but I didn't see any VOSviewer being used in the method nor the graphic showed result from VOSviewer?
Sir when I am using vosviewer, on creation of map, in the type of analysis only co-authorship option is working. (co-occurence, citation, bibliographic coupling, co-citation is not working). please suggest me what to do.
I wish to conduct a bibliometric analysis. Can you please let me know how should I go about preparing the excel sheets and the sequence of your videos I should go through. Thanks in advance
Hi, our recommendation is that you follow the sequence in the playlist at ruclips.net/p/PLQ45kJKYgpbmhyO9dIXe2ur2evFRQA5_U . We also recommend that you finish watching all videos before starting your study, and take notes when watching.
Hello sir ।।। Types of analysis , unit of analysis is fixed for co-authors hip, authors not to be further data।।howa we selected like citation, organization,, please tell me
how do we know which type of analysis we should use? which among them is the most accurate? i've read several journal articles, but they have different conclusions. :(
yes, it depends on your research questions. for example, if you plan to map based on what literature what on what a field was developed, you run co-citation analysis, if you want to map latest developments in the field you run bibliographic coupling.
there could be two reasons: (1) data was not extracted properly, mainly citation data; (2) if you are dealing with a very new field with few articles, there might not be any connection yet.
Hi! Thank you for sharing this video, it was quite helpful! Do you know if there is any way to separate the displayed items in clusters manually, so that i.e., red cluster contains keywords that are related to cars, blue cluster keywords that are related to motorcycles, etc.?
i prefer bibliographic coupling as it reveal emerging themes on a topic in recent years. note that each approach addresses a different underlying research question.
Thank you sir for this wonderful video. I have a doubt. When I have done this procedure there is no year is visible along with reference in the diagram. Could you please help?
@@RESEARCHHUB Thank you for your immediate response, and yes that is exactly the table I was talking about. But how do I create it ? Is there a specific command on VosViewer ?
There are two standard weight attributes, referred to as the Links attribute and the Total link strength attribute. For a given item, the Links and Total link strength attributes indicate, respectively, the number of links of an item with other items and the total strength of the links of an item with other items. For example, in the case of co-authorship links between researchers, the Links attribute indicates the number of co-authorship links of a given researcher with other researchers. The Total link strength attribute indicates the total strength of the co-authorship links of a given researcher with other researchers.
Can we use keywords co-occurrence analysis using Dimensions on Vosviewer? I saw a journal that describes that using Dimensions but could not find the feature on Vosviewer. Thanks
In the context of a literature review, the term "cluster" typically refers to a grouping of research studies, theories, or concepts that share common characteristics or themes. When conducting a literature review, researchers often identify clusters to organize and synthesize the existing body of knowledge on a particular topic. These clusters help in understanding the different dimensions, perspectives, or variables that have been explored in the field.
I am using VOSviewer for bibliometric analysis. I use the data of WOS and Scopus. My question is "How we can detect duplicate files between WOS and Scopus, you have any video, please?
Many thanks for this useful video. However when trying to load the Excel file downloaded directly from Dimensions I receive the following error: '' Error while reading Dimensions file: Index: 0, Size: 0". Does anyone know why?
I got the same error! Download the file and save it in the data folder in VosViewer. Make sure the file is not a zip file. Extract it and save it both as csv and xls. I had to try multiple times before it worked!
hi, thank you very much for the video! Very interesting and useful. I wanted to ask you one thing: is it possible, by doing the co-occurence and author keywords analysis, to then trace back to the source of the displayed data? In other words, once I have done the analysis and displayed the graph as a result of the co-occurrence (author keywords), I would like to "click" on the dot in the graph and see what papers make up that dot. I don't know if I explained myself well, but I hope you can still help me out! thank you very much for the video and again congratulations.
Hi there, thanks for this great video! However, I cannot seem to add data from Dimensions (only VOSviewer corpus files, GML files, Pajek network files, WoS, Scopus, PubMed, RIS files, GML files). Does anyone know why? Thanks!
Hi! I am using dimension database for bibliometric analysis.I need to extract 13k files but dimension allows export of 2500 files at a time so how can I go to the 2500th item directly or give the command of exporting from next 2500th item???


thank you so much for the video! i have been watching a lot of vosviewer tutorial and this is the one that I actually find incredibly helpful. i like that you explain every feature of the software. i also really appreciate you for sharing your personal experience, it gives me a picture of how to use the results. keep it up!
Excellent video! Thank you! I am new to VosViewer and was stuck. This video helped me to get unstuck! I plan to watch all your previous videos. And, by the way, I love Dimensions! Again, thank you, and keep up the good work!
Can you please tell me how to abstract dimensions files and Scopus files over vosviewer
Really helpful sir
Thank you so much for the video
Very interesting. Thanks for sharing
Very helpful, thanks!
Very good presentation. Can you tell me what tool you use to make the videos? Thanks.
Hi in your paper titled "A review of green supply chain management: From bibliometric analysis to a
conceptual framework and future research directions" how did you create figure 6? Can you please guide me about it ?
hi, we created figure 6 manually. We first checked in the reviewed studies which associations were found statistcially significant at 5%. Those were mapped in a excel file. Then the figure 6 was created manually in excel. doi.org/10.1016/j.resconrec.2018.08.004
@researchhub I went through almost all of your freely available videos regarding biblometric analysis but I still need your guidance in problem statement definition (limitations etc)fr my review paper and theoratical framework.I need your paid guidance for that can you tell me how to communicate with u?
I have Scopus login but I can't access web of science:(
THANK YOU SO MUCH FOR MAKING THIS VID!
Can you also use Vos viewer for keyword-context analysis for .txt files without abstract? Not scientifical articles just reports/texts that you upload yourself?
For text analysis, I will recommend text mining approaches, we will soon publish videos on that.
@@RESEARCHHUB which program can you recommend?
@@Eva_Ann.a pls see ruclips.net/video/lqV54nAEvIg/видео.htmlsi=c1a0adYYqWTQJvAo
Can u also make a lesson for how to interpret consequences?
Good work.
Pls how Can WE do keywords and determinants using dimensions ?
Many thanks for the video. You mentioned about review paper using bibliometric analysis. I opened the four articles in the description but I didn't see any VOSviewer being used in the method nor the graphic showed result from VOSviewer?
Sir when I am using vosviewer, on creation of map, in the type of analysis only co-authorship option is working. (co-occurence, citation, bibliographic coupling, co-citation is not working). please suggest me what to do.
same, did you solve it?
@@thaysapc3058 select all the options during extraction of data from database.
How to prepare that excel sheet for biometric analysis can give me idea? I am totally new for this
I wish to conduct a bibliometric analysis. Can you please let me know how should I go about preparing the excel sheets and the sequence of your videos I should go through.
Thanks in advance
Hi, our recommendation is that you follow the sequence in the playlist at ruclips.net/p/PLQ45kJKYgpbmhyO9dIXe2ur2evFRQA5_U
.
We also recommend that you finish watching all videos before starting your study, and take notes when watching.
FANTASTIC
Hello sir ।।। Types of analysis , unit of analysis is fixed for co-authors hip, authors not to be further data।।howa we selected like citation, organization,, please tell me
I want a lewk😂 on co-occurance - keywords chart.. where can I find that ??
how do we know which type of analysis we should use? which among them is the most accurate? i've read several journal articles, but they have different conclusions. :(
yes, it depends on your research questions. for example, if you plan to map based on what literature what on what a field was developed, you run co-citation analysis, if you want to map latest developments in the field you run bibliographic coupling.
very inspring video
very nice
Thanks
Thank you so much for such an informative video.. Also, I tried, but just the names appeared but no linking is being displayed. Can you help?
there could be two reasons:
(1) data was not extracted properly, mainly citation data;
(2) if you are dealing with a very new field with few articles, there might not be any connection yet.
If I want to do a keyword-co occurrence analysis that option is not available.
Hi! Thank you for sharing this video, it was quite helpful! Do you know if there is any way to separate the displayed items in clusters manually, so that i.e., red cluster contains keywords that are related to cars, blue cluster keywords that are related to motorcycles, etc.?
Yes, for that we need to read the articles in the clusters. Also, you can try keyword coupling analysis.
please could you tell me what is the benefit from this program?
Very helpful, thank you! Please, how can I choose the best way to divide the data into clusters? is it by co-citation, keywords... ?
i prefer bibliographic coupling as it reveal emerging themes on a topic in recent years. note that each approach addresses a different underlying research question.
@@RESEARCHHUB Thank you so much for your response! Could u recommend me an article than explain each method's objective?
@@sirineboukhabza3760 see for example journals.sagepub.com/doi/10.1177/1094428114562629
Many thanks!!
Thank you sir for this wonderful video. I have a doubt. When I have done this procedure there is no year is visible along with reference in the diagram. Could you please help?
Thanks for sharing this valuable training. Just wondering if we can use capital letters for authors and countries' names in Network visualization?
No at the moment. Hopefully the developers will update in the future.
Much appreciated.
thank you
Sir can you please share how to write the interpretation for the graphical presentation for co-citation and co -authorship
Please see the method section of this study at www.tandfonline.com/doi/full/10.1080/03088839.2020.1788731
Thank you for posting this very useful video. I have a question: how do I create tables with the resulting cluster data ?
See for example the table in Appendix A of doi.org/10.1080/03088839.2020.1788731
@@RESEARCHHUB Thank you for your immediate response, and yes that is exactly the table I was talking about. But how do I create it ? Is there a specific command on VosViewer ?
@@ciargli We create it manually. You can see the artciles in cluster from vosviewer, then make the table manually based on that information.
@@RESEARCHHUB Thank you very much, you have been very kind
is this data obtained the way you got the search results from dimensions in another video?
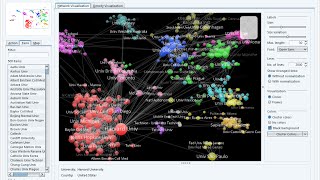
What is the difference between links and total link strength?
There are two standard weight attributes, referred to as the Links attribute and the
Total link strength attribute. For a given item, the Links and Total link strength
attributes indicate, respectively, the number of links of an item with other items
and the total strength of the links of an item with other items. For example, in the
case of co-authorship links between researchers, the Links attribute indicates the
number of co-authorship links of a given researcher with other researchers. The
Total link strength attribute indicates the total strength of the co-authorship links
of a given researcher with other researchers.
Sir can we merge data from Scopus and wos using vos viewer or it can be done only on R...
Hi, does anyone knows how to merge datasets from multiple sources (i.e. web of science and scopus) together and import it into VOSViewer? Much thanks.
one idea could be to use bibliometrix package in r for merging. see researchhub.org/store/bibliometrix-r-script/
great share you course details sir
researchhub.org/p/bibliometric-literature-review
Can we use keywords co-occurrence analysis using Dimensions on Vosviewer? I saw a journal that describes that using Dimensions but could not find the feature on Vosviewer. Thanks
Thanks. Pls Whats that article you are talking about ??
So the data we intended to download from scopus was too large, and we needed to separate the file. Do you have any idea how to combine the data?
Put all the files in a folder and create a ZIP version, zip files work file in BIblioshiny.
How can I increase the size of the figure of VosViewer figure?
Brilliant!
What does a cluster mean?
In the context of a literature review, the term "cluster" typically refers to a grouping of research studies, theories, or concepts that share common characteristics or themes. When conducting a literature review, researchers often identify clusters to organize and synthesize the existing body of knowledge on a particular topic. These clusters help in understanding the different dimensions, perspectives, or variables that have been explored in the field.
I am using VOSviewer for bibliometric analysis. I use the data of WOS and Scopus. My question is "How we can detect duplicate files between WOS and Scopus, you have any video, please?
Sir do you have access to WOS and scopus ??
@@mathushan7318 Scopus only.
@@anwarkhanmarwat sir, I need data about human resource management and innovation
@@mathushan7318 Comment search term with possible options to be excluded/included. I will send csv of scopus
@@anwarkhanmarwat HRM, human resource management, HRM practices. And innovation
My topic is human resource management and innovation
Many thanks for this useful video. However when trying to load the Excel file downloaded directly from Dimensions I receive the following error: '' Error while reading Dimensions file: Index: 0, Size: 0". Does anyone know why?
I got the same error! Download the file and save it in the data folder in VosViewer. Make sure the file is not a zip file. Extract it and save it both as csv and xls. I had to try multiple times before it worked!
hi, thank you very much for the video! Very interesting and useful. I wanted to ask you one thing: is it possible, by doing the co-occurence and author keywords analysis, to then trace back to the source of the displayed data?
In other words, once I have done the analysis and displayed the graph as a result of the co-occurrence (author keywords), I would like to "click" on the dot in the graph and see what papers make up that dot.
I don't know if I explained myself well, but I hope you can still help me out! thank you very much for the video and again congratulations.
You ca try this in biblioshiny, ruclips.net/video/9YwVhFEovCA/видео.htmlsi=CTnG1Y4ZSFJQNgYc
can I open multiple csv files in vosviewer at the same time?
yes, simply load one after another.
How can we search a topic in VOS viewer?
VosViewer is for data analysis, see ruclips.net/video/nLBEU2Tul9Q/видео.htmlsi=rNnHQ7QHzvrHZ_Jy
how can i convert from CSV to Bib?
It's asking for java runtime
pls proceed with java installation
Hi there, thanks for this great video!
However, I cannot seem to add data from Dimensions (only VOSviewer corpus files, GML files, Pajek network files, WoS, Scopus, PubMed, RIS files, GML files). Does anyone know why?
Thanks!
Hi, are you using the latest version of VOsviewer? and also, have you selected "create a map based on bibliographic data"?
Hi! I am using dimension database for bibliometric analysis.I need to extract 13k files but dimension allows export of 2500 files at a time so how can I go to the 2500th item directly or give the command of exporting from next 2500th item???
I keep getting index 0 size 0 error wtf
starting music is too loud and actual voice is too soft
Lulu Hill
Okay, but the fake accent is really unnecessary. You seem to be confused between american, english and australian accents.
Follow me on LinkedIn to understand why my accent is like this www.linkedin.com/in/ziaulmunim?