Create Bar Graphs on SPSS (Between-Group Designs)

HTML-код
- Опубликовано: 15 июл 2024
- Learn how to create bar graphs on SPSS with either a continuous or categorical dependent variable. We’ll also look at formatting graphs so that you can get them just how you like!
0:00 Introduction
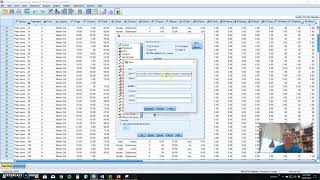
0:47 Bar chart for continuous dependent variable
1:47 Bar chart for categorical data
2:27 Clustered bar chart for categorical data
3:20 Bar chart formatting
#spss #graphs #barchart #barcharts


thank you!
Thanks, glad it helped!
imagine you'd want to add a third column by treatment type. let's say total population. as in total + yes + no diagnosis. how could you do that?