Размер видео: 1280 X 720853 X 480640 X 360
Показать панель управления
Автовоспроизведение
Автоповтор
The sieve size value of the second row (S/N 2) is 2.0 and not 20
Thanks for helping, it got me confused 😢
2024 still effective such videos are timeless 🙏 more wisdom be upon you.
Thank you very much .May God protect you
Very clear and simple explanation. Thank you.
Glad you liked it
WELL EXPLAINED WITH CLEAR UNDERSTANDID😉
Best explanation
keep posting more vidoes related to this. please it helped me alot. thank you sir.
I'm glad it was helpful
Everything i needed good explanation
This was very helpful
How to calculate the % of silt and clay from it
It's very usefull.nice explanation sir tnq u so much sir 💕
Thanks a lot, very helpful
You're welcome!
Is % weight retained the same thing as individual weight (%)?
Thanks alot very helpful
Perfect video sir. Do we really need to consider the soil mass in pan to draw the graph? Or not?
Nope
Thanks a lot this sharing the video. It’s really helpful.
Thank you for this video, learned a lot. Mind if i ask questions? What is the maximum size and nominal maximum size of this calculation?
The maximum size is 2.8 mm, and the nominal maximum size is 1.40 mm
Thank you for sharing the video. This is really helpful. You may just want to correct the 20mm (it should be 2 mm) for sieve size
Hey, that was a typo... There is supposed to be a point between the two and the zero. Thanks for watching...
GOOD TEACHER
علي الطلاق انت رجوله
Thank you for the video
Well explained... Thanks
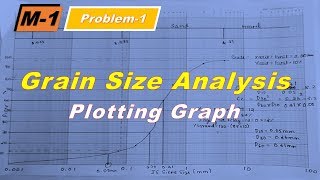
How to plot particle size distribution curve, guide me in this regard plz
I have already done that with Microsoft Excel. If you want it manually with a pen and semi-log graph paper, I will do that later.
@@MagmaUpwelling I want that video too, is there a link to it that I can watch it
Thank you 🙏🏾
This really is the best, but where is the graph…?
The link is in the description box
Thank u sir useful
Thank you, clearly explained and got to the point!
You are welcome... Subscribe for more videos like this
Thank you sir❤
Thank you.
Thanks boss
Characteristics of contuse
Thanks
Thank you
You are welcome
Thank you teacher


The sieve size value of the second row (S/N 2) is 2.0 and not 20
Thanks for helping, it got me confused 😢
2024 still effective such videos are timeless 🙏 more wisdom be upon you.
Thank you very much .May God protect you
Very clear and simple explanation. Thank you.
Glad you liked it
WELL EXPLAINED WITH CLEAR UNDERSTANDID😉
Best explanation
keep posting more vidoes related to this. please it helped me alot. thank you sir.
I'm glad it was helpful
Everything i needed good explanation
This was very helpful
How to calculate the % of silt and clay from it
It's very usefull.nice explanation sir tnq u so much sir 💕
Thanks a lot, very helpful
You're welcome!
Is % weight retained the same thing as individual weight (%)?
Thanks alot very helpful
Perfect video sir. Do we really need to consider the soil mass in pan to draw the graph? Or not?
Nope
Thanks a lot this sharing the video. It’s really helpful.
Thank you for this video, learned a lot. Mind if i ask questions? What is the maximum size and nominal maximum size of this calculation?
The maximum size is 2.8 mm, and the nominal maximum size is 1.40 mm
Thank you for sharing the video. This is really helpful. You may just want to correct the 20mm (it should be 2 mm) for sieve size
Hey, that was a typo... There is supposed to be a point between the two and the zero. Thanks for watching...
GOOD TEACHER
علي الطلاق انت رجوله
Thank you for the video
Well explained... Thanks
How to plot particle size distribution curve, guide me in this regard plz
I have already done that with Microsoft Excel. If you want it manually with a pen and semi-log graph paper, I will do that later.
@@MagmaUpwelling I want that video too, is there a link to it that I can watch it
Thank you 🙏🏾
This really is the best, but where is the graph…?
The link is in the description box
Thank u sir useful
Thank you, clearly explained and got to the point!
You are welcome... Subscribe for more videos like this
Thank you sir❤
Thank you.
Thanks boss
Characteristics of contuse
Thanks
Thank you
You are welcome
Thank you teacher
Thank you