TRIANGULAR GRAPHS (Reading & Understanding)

HTML-код
- Опубликовано: 13 сен 2024
- #geography #cxc #cape #form6 #graphs
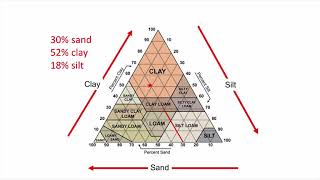
The objective of this video was to highlight and simplify the way in which triangular graphs are read and understood. This is an important mathematical tool which can also encompass other fields of study such as Geography and Environmental Science. Hence, it is vital to gain a level of appreciation and truly be able to read, understand and also interpret the more specific components which may be embedded.


It was a completely new concept to me thanks to u for helping me to have a crystal clear idea of how read this kind of graphs
I'm glad it was helpful..keep studious
wow this is crystall clear man thank you
welcome buddy
You sir are a legend👍
Thank you..I'm glad it was helpful...feel free to Subscribe, share and like for future videos
Thank you so much! I just had one doubt.
These triangular graph show what is the composition of the items inside the graph based on the axis values, not the other way around right ?
Like, In the first example (9:14) the graph says that sample A has 40% Sand, not that 40% of the entire Sand is in A.
For every item involved in the triangular graphs the constituents are categorised in percentage values where they all add up to 100%
@@bhosein I see, alright, got it. Thx again.
@@alpharigel5777 anytime. Keep good..i appreciate the questions and feedback
But how do you read the values if the point is probably not exactly in line junction??
it can be potentially in a decimal or fraction... remember all the values from all three sides must add up to 100%
hey good analysis, what is your email?
bashiruddinhosein@gmail.com