Mark independent sides to be the measure of each of the variables. You can read off values using 3 particular directions that remain in that orientation as you move the point in the center. It makes it easier to locate and identify the internal points. For example. Label the triangle points to be 0. Label the sides in a clockwise direction to be 18, 36, 54, ... 180. Each point in the diagram defines the angles of unique triangle ABC that are easily read from the marked scales on each side..
One application is examining the composition of crystallizing magma, where every corner of the diagram represents one chemical component. Generally examining the behaviour of multi-component systems (even more than three compenents by adding cotectic lines and isotherms). You trace the crystallizing path along the diagram.


Spent the last 3 years at uni not understanding it, only stumbled across this now, recon I will pass my exam tomorrow now
I spent so long not understanding a thing until I saw your video. Thank you, you saved a dental student!
Very good. This will be very helpful for a lot of students.
Thanks, man! Very clear and friendly explaination :)
great...learned the plot point in the ternary mixture! great job!!
The book cannot explain such an easy thing man just thank you
You're a lifesaver! Thank you.
Very resourcefully. Had a lot of problem explaining it during my presentation; natheless, I am confident now for the next one. Much oblige
Very well explained, thank you!
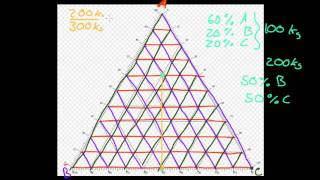
Mark independent sides to be the measure of each of the variables. You can read off values using 3 particular directions that remain in that orientation as you move the point in the center. It makes it easier to locate and identify the internal points.
For example. Label the triangle points to be 0. Label the sides in a clockwise direction to be 18, 36, 54, ... 180. Each point in the diagram defines the angles of unique triangle ABC that are easily read from the marked scales on each side..
Another Great RUclipsr helping the whole world rather than just posting a stupid prank video that may get a million likes. Thank You, bro!!
Thanks; great video! I think I finally understand these types of diagrams.
Thanks, now im ready for my prac!
Thank you very much. Very useful and clear.
What program are you using for drawing? Very good explanation!
This video was soo helpful. Great explanation. Thank you :))
Thank you so much for this important information. It is very clear.
Glad it was helpful!
thank you very much! step by step procedure on how to use the diagram.
Clear and simple, thanks a lot
Good job.Thanks much.
Wow thank you so much! My human geog doubts are cleared!
Thanks for your video! Still getting a bit confused but I do get it. Just need to practice! Thanks again!
very well explained thank you very much!
I definitely needed this, tysm bruv
thank you man! good job
Good job! Thanks.
Very helpful, thanks.
Thank you so much sir. This explanation is clear and to the point
Thank you!
Wow it was actually very well explained
One application is examining the composition of crystallizing magma, where every corner of the diagram represents one chemical component. Generally examining the behaviour of multi-component systems (even more than three compenents by adding cotectic lines and isotherms). You trace the crystallizing path along the diagram.
toolazytofindaname no
Quite helpful
:) Thank you!
thank you very much
this video really helped thanks :)
Thank you very much).
Thanks a lot!
excellent❤❤❤
thanks alot it was so helpful
muchas gracias
you are my angel!!!!
thank you
very good!
Thank you
Thank u 🌹❤️
thank you bro
which software you used for plotting psudoternary phase diagram..?
SigmaPlot or Origin...
thank u
thank you :)
THANK U
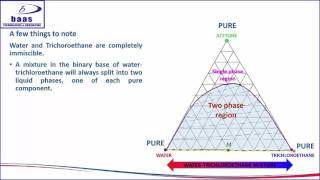
Another application is to do the partially immisible liquid liquid extraction problem.
where is the second video?
You may have some interest in a series of videos focused on reading crystallization paths: ruclips.net/video/NuvEzQX0xnk/видео.html
I was great
daddy
bruh what is this
Thank you
Thank you