Wed 6/5/24 - Southwest heat wave | How to use 700 mb charts to find the extent of storms

HTML-код
- Опубликовано: 1 окт 2024
- Tim Vasquez is a former Air Force / Air Weather Service meteorologist.
No other channel brings you the latest AWIPS graphics -- the same charts used at the National Weather Service forecast desk. If you want to see more of these videos, or would like to say thanks for this one, please consider becoming a supporter.
/ metlab
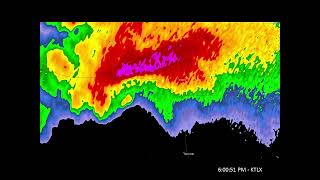
0:11 Storm summary
1:39 Texas mesoanalysis
2:32 Surface analysis
4:35 Alaska / Canada
5:41 700 mb chart
6:54 500 mb chart
8:14 250 mb chart
10:02 Hovmoller diagram
11:47 Surface forecast
15:17 Closing
------------------------------------------------------------------------------------
RUclips: / forecastlab
Facebook: / timvasquezweathergraphics (pls don't use Messenger)
Twitter: / weathergraphics
Email: www.weathergrap...
-------------------------------------------------------------------------------------
You can support our channel via Patreon
/ metlab
or pick up some books or software (these support us too!) at
www.weathergrap...


I'm probably one of the closest of your viewers to Hudson bay. Its a bit over 1000 Km NNW from here in bird flight.
Hot and humid here today, saw some thunder clouds N.
Anyhow, just wanted to thank you 👍
Thank you, appreciate the comments!
Thank you Tim. A very good presentation once again! Here in Sacramento temps got up to 104* today with last nights temps remaining in the mid 80s for most of the night. Nice to see a break from all of the Supercells and Tornadoes in the mid western region. Take care.
Tim! Cool! The 500 MB chart looks like the ones I learned on in Aerography school and then saw when I did week-end warrior Reserve duty at NAS Dallas. Much cleaner and informative, better dileneating the highs and lows to give a better sense of expected phenomena! Thanks
Thanks for the comments! I do like the classic 500 mb Daily Weather Map look and plan to use a few of those charts in my upcoming books.
Thanks Tim, when yo mentioned Hovmöller diagrams, I paused and did a quick refresh. Keep mixing it up, love it!
Thanks, will do!
0:30 appreciate that recap. I'm in OKC and it was strange to watch that system develop.
Thanks, appreciate the commentw!