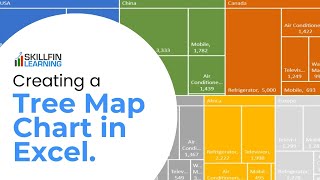
Create a Treemap

HTML-код
- Опубликовано: 21 авг 2024
- What's a treemap chart? It's basically a way to see groupings of your data in a sort of hierarchy. You've probably seen this type of chart in online articles. It looks like a bunch of rectangles of various sizes enclosed in one big rectangle. Also there are different colors to differentiate the groups. Before Excel 2016 this was a difficult chart to make because you would have to manually calculate the dimensions relative of each element. With Excel 2016, it's just a couple mouse clicks and you've got a beautiful treemap. Check the video out to see how easy it is to do.
P.S. Feel free to provide a comment or share it with a friend!
#excel
#msexcel
#excel
#msexcelandtricks
#exceltutorial
#doughexcel
#excel101
---------------------
Excel Training:
www.exceltrain...
Excel Books:
www.amazon.com...
#excel
#msexcel
#doughexcel
~-~~-~~~-~~-~
Please watch: "Convert Table in a PDF File to Excel"
• Convert Table in a PDF...
~-~~-~~~-~~-~


Yet another great tutorial. Thanks a lot Doug :-)
+Alex Rosén Thanks for the comment!
Thank you Doug, I did not know you could use a second column to group the data. I followed your example and made an Excel Table of the list. I also added country/HQ. So you could make a slicer of the country value. In this way you can see the economic structure for the largest 50 companies (depending on the range you choose) per land. So adding a slicer is realy cool.
Hi Bart Titulaer, glad you liked it, thanks for commenting!
@@DougHExcel great tutorial!!,, can you please teach how to group data of different columns under the same banner..
Good one Doug
Hi RRR program, thanks for the comment!
Nice
Thanks Abhishek Shinde!