My tuition fees should go straight to you! You explain and deconstruct statistics with such efficiency, pedagogy and humanity. Honestly, I learned a lot more by listening to your videos than by attending 3 hours lectures that left me completely clueless once over. Really, a huge thank you!
This series of videos was incredibly helpful while working on a data project for my graduate-level regression course. Even more helpful would be another series of videos summarizing how to interpret regression coefficients for regression equations using dummy-coding, weighted and unweighted effects coding, contrast coding, continuous predictors, and interactions with all of these. It gets so confusing!
THANKS is not enough.. i should say more than that, I started my day with logistic regression, planned to complete in 2 to 3 hours.. i had gone through lot of stuff which lead to confusion between logit and sigmoid function..... felt bad and sad, that i couldn't make it, then your stuff came, it is SAVIOUR.. You explained very clearly, detailed every thing in simpler manner. I ended my day with SMILE with your stuff.. APPRECIATE.. APPRECIATE.. APPRECIATE... Expecting stuff on Machine Learning Algorithms too.
Will you consider going through the MLE? Thank you for these videos, i can totally say that these videos are pure gold for me. As a machine learning student who is thinking about a phd in 1 year, these kind of videos gave me a great boost of my actual knowledge!
Finally starting to get a handle on logistic regression--a calculus I have always appreciated so it's nice to begin to understand it (other than the algebra...). Looking forward to learning about the maximum likelihood. Much appreciation, Brandon.
Great video. Wish my professor would teach like this. It took us 4.5 hours to go through this topic in class AND it was more difficult to understand. Thank you so much.
I tried to take a stats class (online through my Univ.) and dropped the class. I just talked to another grad student in our Environmental Science program, and she too, dropped that class. We both are great students. Brandon, you are a spectacular instructor. I wish I had of known about your videos a year ago. Alls well. I have weird data to analyse or I won't get my degree. I'm glad one of my committee members is going to help me, but I'm going to keep watching your videos. Stats is a must know if you do any kind of science or read many research papers. You are great.
Dear Brandon! Thank you very much for these videos! So clear & clever derivations. And I see how much work goes into making such quality videos. Great job! Can just relax and be sure you will get us out that jangle of math & stats :) Let know if we (your audience) can be of any help in making more of these videos? Thank you!
this is wonderful! you make it so simple to understand. I honestly read books about logistic regression, all so complicated! Anyway, keep up the good work, you are amazing :)
Thanks Brandon, really helpful! If this series were extended to Probit models, it would make this a complete series for introductory level Logistic Regression.
Hi Brandon. I'm new to statistics and is trying to understand it. I am very glad to come across your videos! My question is which video would you recommend watching for a newbie like me that knows nothing about statistics?
Hi! thanks so much for sharing this. Can I ask how you get the 3.289 score for the numerator in P hat? I plug in the same numbers but get 1.19 Thank you so much!
hey brandon when i tried out with same sets of data(same as yours , 15 obesrvations as it is) , the coieffents were different , cant figure it out and cant procedd it without figuring it out , any keys ?
Hi Brandon, thanks for the video (s)! If I understood correctly, if 1 is included in the C.I (be it upper or bottom level) that variable doesn’t have any impact on the odds, right? In this example 1 is not included so that's why we expect a change of 1.0147 change. Correct me if I'm wrong. Thanks!
Gradient descent is one algorithm; I believe there are others (which may arrive at a solution in a more computationally efficient way). Briefly, gradient descent is really just guessing. Try one set of coefficients, and then adjust one of them up or down to see which set better fits the data. Keep doing this until you find the best answer for that coefficient. Then try adjusting another coefficient. Keep doing this until you think you've converged onto the best answer, or something sufficiently close to the best answer. This makes logistic regression very different, in a sense, from linear regression, which has a single, deterministic, absolute best answer for a given data set.
Hi. Thanxs for your great videos. I got a litle bit confused about the odd ratio in the output, an have a question about that. ( I think this is show as Exp(b) in SPSS.) Can this odd ratio be interpreted as : for each unit increase in your creditscore, the odds for getting aproved increase with 1,47 %?
can the p-hat be more than 100% and less than 0% ? Also what is "e" in equation? Thanks for putting up this video, very helpful in learning and If I know answer to above will help me apply this in my decision making process. thanks a tonne.
Question: the FICO score of 720 gave us 3.289:1 odds of being accepted for the loan; but what is the reference score???? i mean, 3 times more likely to receive the loan compared to what score? Thanks!
Hi Brandon, long time viewer here! Can you explain whether the Odds Ratio of 1.0147 (and CI) as well as the FICO coefficient of 0.0146 are eerily alike? Is that a coincidence? Or can I just slap on a 1 to get an odds ratio from the coefficients? Thanks!
Hi Brandon, Suddenly had a doubt, why is comparison done by odds ratio (i.e using odds and not probability)? Will it be proper to do probability ratio? Is this mainly because of the logit function?
this is where You tube video which are promising suddenly head a road block. at 3:23 suddenly we are shown a bunch of results and not sure how to arrive at them. Atleast a high level input would help. I'm using R , please clarify.
You're right, but in video 3 of this series he says that the coefficients are estimated using MLE (maximum likelihood estimation), which he is not going to describe in this series.
You let so many things unexplained and even worse don't reply back to comments. NO explanation why if the confidence interval contains 1, then that means that increasing the credit score by 1 point does not have any effects on odds''?? I do realise 1 is an issue but rest values aren't. Similarly on previous video confusion between odds and odds ratio and why "the odds ratio for a variable in logistic regression represent how the odds change with a 1 unit increase in that variable holding all other variables constant'' Elaborate please.


My tuition fees should go straight to you! You explain and deconstruct statistics with such efficiency, pedagogy and humanity. Honestly, I learned a lot more by listening to your videos than by attending 3 hours lectures that left me completely clueless once over. Really, a huge thank you!
I am amazed by the ability to explain in so a coincise and precise way.
can you explain , how the coeiffents are calculated ?
Brandon is a great instructor. He makes this material so reachable.
This series of videos was incredibly helpful while working on a data project for my graduate-level regression course. Even more helpful would be another series of videos summarizing how to interpret regression coefficients for regression equations using dummy-coding, weighted and unweighted effects coding, contrast coding, continuous predictors, and interactions with all of these. It gets so confusing!
I watched all the videos for Logistic Regression. You are a phenomenal instructor. Hats off!!
This series is so underrated. Thank you Brandon! you have a gift, don't hide that in a bushel basket.
Teacher... I don't know who you are, but I truly love you and respect you. THANK YOU VERY MUCH!
THANKS is not enough.. i should say more than that, I started my day with logistic regression, planned to complete in 2 to 3 hours.. i had gone through lot of stuff which lead to confusion between logit and sigmoid function..... felt bad and sad, that i couldn't make it, then your stuff came, it is SAVIOUR.. You explained very clearly, detailed every thing in simpler manner. I ended my day with SMILE with your stuff.. APPRECIATE.. APPRECIATE.. APPRECIATE... Expecting stuff on Machine Learning Algorithms too.
I have been trying to solve for p (hat) for a week, and I found it in your video in under 3 minutes. Good job Brandon.
Excellent videos on Linear Regression. Very nice slides and a clear explanation. Thank you, Brandon.
best content ever on logistic regression
Your explanations are the best. Feeling more confident for my Stats test tomorrow. Thank you! :)
Excellent! How did the test go?
I'd like to think it went fine haha.
Will you consider going through the MLE?
Thank you for these videos, i can totally say that these videos are pure gold for me. As a machine learning student who is thinking about a phd in 1 year, these kind of videos gave me a great boost of my actual knowledge!
Finally starting to get a handle on logistic regression--a calculus I have always appreciated so it's nice to begin to understand it (other than the algebra...). Looking forward to learning about the maximum likelihood. Much appreciation, Brandon.
thank you for making these videos. i am binge watching your videos for my statistics exam. wish me luck
Wou!! Finally I got the concepts. Thank you so much.
can you explain , how the coeiffents are calculated ?
If I give you more than one thumb-up, I want to give you as much as I can. Thanks for your video. Your statistics lecture is the best ever.
Great video. Wish my professor would teach like this. It took us 4.5 hours to go through this topic in class AND it was more difficult to understand. Thank you so much.
Brandon you are doing a great job. This is helping me to get hands on machine learning concepts. Thank you!
A very comprehensible explanation of the logit model. Thank you very much.
Very nice explanation.. I am watching all the videos of Brandon .. They are wonderful.Thank you so much Brandon ..
I've watched a few of your videos. Top notch. Great job!
I tried to take a stats class (online through my Univ.) and dropped the class. I just talked to another grad student in our Environmental Science program, and she too, dropped that class. We both are great students. Brandon, you are a spectacular instructor. I wish I had of known about your videos a year ago. Alls well. I have weird data to analyse or I won't get my degree. I'm glad one of my committee members is going to help me, but I'm going to keep watching your videos. Stats is a must know if you do any kind of science or read many research papers. You are great.
***** Thank you Yvette :) Very happy you find the channel helpful. It is why I do it. Hang in there you can do it. Perseverance wins the race.
Thanks for sharing, I appreciate your approach. keep it up!
You have a very good and systematic approach!! Some of my doubts are cleared now!
Awesome video and overview. Thanks Brandon!
Dear Brandon! Thank you very much for these videos! So clear & clever derivations. And I see how much work goes into making such quality videos. Great job! Can just relax and be sure you will get us out that jangle of math & stats :) Let know if we (your audience) can be of any help in making more of these videos? Thank you!
this is wonderful! you make it so simple to understand. I honestly read books about logistic regression, all so complicated! Anyway, keep up the good work, you are amazing :)
Loved it.
Your explanation is perfect.. Thank you so much for doing this.. It is great..
can you explain , how the coeiffents are calculated ?
Thanks Brandon, really helpful! If this series were extended to Probit models, it would make this a complete series for introductory level Logistic Regression.
Thank you very much for such a good explanation
What are the odds of you making a video about MLE? It would be cool to understand how to estimate those coefficients
gosh ur lecture made me love stats so much... who needs drugs if you have stats! I am in love!!!
Well explained, very helpful. Thank you!
can you explain , how the coeiffents are calculated ?
brandon best G.O.A.T!
you are an amazing teacher. tnx :)
Perfect,keep it up Pro
*NEW* Statistics 101: Logistic Regression, Estimating the Probability. Enjoy!
+Brandon Foltz could you plz
make a video about calculating maximum likelihood for the logit model ...??
+Brandon Foltz Hi I have a question. Can you explain a bit more about how you get the coefficient and FICO score?
Would you like to go through the calculation behind MLE ? That'd would be extremely helpful 😍
This is soooo helpful. Thank you!!!!
can you explain , how the coeiffents are calculated ?
I skipped the LOGIT-lectures in my statistics course. This video helped me a great deal though!
This channel is damn good.
Love u man ❤️ good job
Hi Brandon. I'm new to statistics and is trying to understand it. I am very glad to come across your videos! My question is which video would you recommend watching for a newbie like me that knows nothing about statistics?
Everything begins here: ruclips.net/user/bcfoltzplaylists :) Are you in a stats class now?
Yes. It's my first time in stats and I know nothing. I just started to learn about the levels of measurements. It has been very confusing.
MsMalleyV In addition to my playlists I also recommend Khan Academy for very good explanations.
Hi! thanks so much for sharing this. Can I ask how you get the 3.289 score for the numerator in P hat? I plug in the same numbers but get 1.19
Thank you so much!
You are a legend
Brandon, Could you post something explaining Entropy? I have watched several of your videos and they are excellent. Thanks for sharing your knowledge!
Dear Brandon, could you please advise the storage loaction of the datasets which you have referred in your videos..thanks,
May I know how to calculate the 95% confidence interval for the odds ratio? What type of distribution does odds ratio obey? Thank you.
Thank you! You really helped a lot!
can you explain , how the coeiffents are calculated ?
Thanks for the amazing videos really appreciate it
3:23, 4:36, how do you get the TABLEs... More interested in how to calculate the coef...
hey brandon when i tried out with same sets of data(same as yours , 15 obesrvations as it is) , the coieffents were different , cant figure it out and cant procedd it without figuring it out , any keys ?
Hi Brandon, thanks for the video (s)!
If I understood correctly, if 1 is included in the C.I (be it upper or bottom level) that variable doesn’t have any impact on the odds, right? In this example 1 is not included so that's why we expect a change of 1.0147 change. Correct me if I'm wrong. Thanks!
how did u calculate coefficients in the video?/ or how to calculate beta0 and beta1?
Did you get the answer?
KAMLESH KARKI yeah
you need to use gradient descent method to calculate them
Gradient descent is one algorithm; I believe there are others (which may arrive at a solution in a more computationally efficient way). Briefly, gradient descent is really just guessing. Try one set of coefficients, and then adjust one of them up or down to see which set better fits the data. Keep doing this until you find the best answer for that coefficient. Then try adjusting another coefficient. Keep doing this until you think you've converged onto the best answer, or something sufficiently close to the best answer. This makes logistic regression very different, in a sense, from linear regression, which has a single, deterministic, absolute best answer for a given data set.
How do you get 3.289?
I want to know how you calculated the intercept and the slope of the phat fucntion. What was on the x axis and y axis when calculating this?
Hi. Thanxs for your great videos. I got a litle bit confused about the odd ratio in the output, an have a question about that. ( I think this is show as Exp(b) in SPSS.) Can this odd ratio be interpreted as : for each unit increase in your creditscore, the odds for getting aproved increase with 1,47 %?
Maricel K Watch video 5 and let me know if you have any questions. I go over that in detail there. Thanks for watching!
***** Thanks! I got my answer in that video. Iæll keep watching your videos! Maricel
can the p-hat be more than 100% and less than 0% ?
Also what is "e" in equation?
Thanks for putting up this video, very helpful in learning and If I know answer to above will help me apply this in my decision making process. thanks a tonne.
Yeah what do you substitute to the e?
I have the same question about the value for e
Question: the FICO score of 720 gave us 3.289:1 odds of being accepted for the loan; but what is the reference score???? i mean, 3 times more likely to receive the loan compared to what score?
Thanks!
what if the constant's p-value is more than 0.05 . how to interpret this
Thanks for the video. Quick Q, how do you regress Y=b0+b1*x1? It's clear what series X1 is, but what is your Y series here?
can logistic regression be used for interval data ?
Hi Brandon, long time viewer here! Can you explain whether the Odds Ratio of 1.0147 (and CI) as well as the FICO coefficient of 0.0146 are eerily alike? Is that a coincidence? Or can I just slap on a 1 to get an odds ratio from the coefficients? Thanks!
Can odds ratio be negative? If not why would Stata produce negative dy/dx (marginal effects) for independent variables?
Dear sir
How can we calculate the beta 0 and B1 manually like simple linear equation.
Hi Brandon,
Suddenly had a doubt, why is comparison done by odds ratio (i.e using odds and not probability)? Will it be proper to do probability ratio?
Is this mainly because of the logit function?
How about the equation if you use more than one predictor?
Thanks!
can you explain , how the coeiffents are calculated ?
this is where You tube video which are promising suddenly head a road block. at 3:23 suddenly we are shown a bunch of results and not sure how to arrive at them. Atleast a high level input would help. I'm using R , please clarify.
+gsrini did you start at the beginning of the playlist?
Hi, I just want to ask how to know the goodness of fit of the model. Thanks
can you make a video on how the coefficients are calculated?
did you got it , could you please explain it to me , or where you found ?
Thanks
can you explain , how the coeiffents are calculated ?
This video still didn't answer how beta0 and beta1 are calculated.
You're right, but in video 3 of this series he says that the coefficients are estimated using MLE (maximum likelihood estimation), which he is not going to describe in this series.
why do we seperate probabulity and odds. im little bit confused der
can you please share the data-set used in the video
Hello, Nikhil. Did you get the data ?
can anyone explain , how the coeiffents are calculated ?
But how we can calculate bita0 and bita 1?
Please put the "click the next video" at least in the middle.
My g
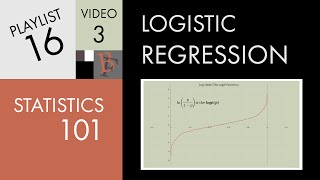
written as natural log of odds ratio & in audio and in formula written as log of odds (not log of odds ratio) ............check again
You let so many things unexplained and even worse don't reply back to comments.
NO explanation why if the confidence interval contains 1, then that means that increasing the credit score by 1 point does not have any effects on odds''?? I do realise 1 is an issue but rest values aren't.
Similarly on previous video confusion between odds and odds ratio and why "the odds ratio for a variable in logistic regression represent how the odds change with a 1 unit
increase in that variable holding all other variables constant''
Elaborate please.
can you explain , how the coeiffents are calculated ?