User Defined Nonlinear Fitting Using OriginLab 2021 | Drawing/Graphing-28

HTML-код
- Опубликовано: 10 авг 2021
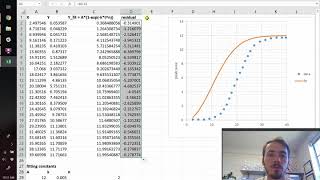
- In this video, I will teach you about a user defined nonlinear fitting to the experimental data with originlab 2021.
------------------------------------------------------------------------------------------------
If this worked and helped you
Do not forget to Like, Comment, and Subscribe !
=================================================
► To Watch all our videos, click here - goo.gl/aCCrzi
► Subscribe to our channel, click here - goo.gl/9QCQhC


Thanks for providing this video. It solved my problem.
Hi , what graph would you suggest to show the results of a whole class of an experiment where you have : 2 species , gram staining results, oxidase results, catalase results, thioglycollate results, 2 type API results, 7 digit code results and O2 results and shape of bacteria results? Pleaseee
thanks a lot
Most welcome.
Non linear control system using neural network
Hey Sir! Hope you're alright. We missed your videos.