As I know, we can also find dna concentration (ug/ul) of a band if we know dna concentration of ladder. But how to find actual mass of certain band. Lets say I loaded 3ul. But then it separated to several bands. How can I find volume in each band?
In the video, it's shows 10% until 15%.. What is the band of 100% ? And could we calculate percentage by comparing 2 bands ? For example band A 60% and band B 40% ?


real useful stuff! much better than those non-video tutorials!
Thanks for the video. Very helpful as i was doing it for the first time.
Hi Kenny, thank you so much for this tutorial! So helpful!!
God bless.
Greetings from New Zealand.
As I know, we can also find dna concentration (ug/ul) of a band if we know dna concentration of ladder. But how to find actual mass of certain band. Lets say I loaded 3ul. But then it separated to several bands. How can I find volume in each band?
I used to just draw rectangular boxes on the bands and measure the intensity of that. How is that different from this approach? Thank you!
Hundred thanks for your great useful video
I love you so much really saved me
Hi what is the benefit of using one big box instead of individual boxes around each blot?
Thank you for saving so much of my time and energy!!!
Thanks a million. You saved my day! : ) God bless you.
It is really helpful, thank you.
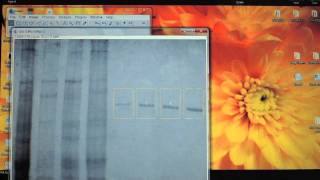
Analysis of SDS-Page has been done by the quick & dirty method (Kenny, 2012).
Can Image J evaluate the purity level of protein? How can I mesure purity level of protein? Please, help me
Thanks for the video
If I Want to calculate fold change how would I do that and then plot graph in excel?
OMG Thank the Research Gods!!!! I totally appreciate this!!!!
Love your desktop at the start, do you have a link for it?
Here you go: i.imgur.com/hdijH.jpg
great tutorial,thanks
Thank u very much! You are a life saver!
Awesome man!!
very useful, thanks
Great job! Thanx a lot.
thank you very much!
Where can i download the software
Right here imagej.nih.gov/ij/
Thank you very much
thank you
The % is calculated respect to what?
To whatever you want.
In the video, it's shows 10% until 15%.. What is the band of 100% ? And could we calculate percentage by comparing 2 bands ? For example band A 60% and band B 40% ?
I don't believe ImageJ is capable of opening pdf files. Convert your images to a tif file first.
Thank you so much!