Very helpful, thank you for making this video! You mentioned that 'charts don't need titles', when they literally ALWAYS do. It's a habit that should be hammered into people in all scientific fields.
Oof. I'll have to disagree. Captions, axes labels, legends yes, but titles certainly not. Here is the resource that I share with all my students www.mrl.ucsb.edu/~seshadri/PreparingFigures-February2020.pdf
@@TaylorSparks Hey Taylor, Thanks for the nice video. So, If I have to use the weibull.dist formula in excel, will the alpha be 2.8941 and beta be 17.047?
Bonjour. Svp j'ai un problème sur Excel. La distribution ne semble pas reconnaitre les facteurs K et C comme paramètres (alpha et béta), mais comme valeurs normales, d'où elle les rejettent.
First of all. Thank you for the videos, very helpful. I was wondering how you would go about performing a Weibull analysis were the failure is time-based and not based on stress. Lets say you have a 100 samples that you tested cyclicly to determine the endurance limit. Only 20 samples failed and the other samples did not fail after 1E6 cycles. How do you go about saying something about the reliability of XXX cycles? I have calculated it too and would like to see your reasoning. Kind regards Gerhard
Thank u so much, I have a question about "y" I saw there are different equations and it depends the number of data, I was reading a book that the equation it was y=(i-0.3) /(n-0.4) and gave me a different result from y=(i-0, 5) /n, I wish to know which is the best, my n=3
First of all, thanks for the video, excellent work. At the beginning you say to use at least 20 (experimental/observed values), is there any work that recommends this value? I read the original article and there, Weibull presents example with 10 values. Some articles that I have read in Elsevier show results with 5/8/10 values. So, I was left with this question. Thank you again Professor.
This is a good article on the topic. Essentially, more samples is greater confidence. www.researchgate.net/publication/259388853_Influence_of_Sample_Size_on_Strength_Distribution_of_Advanced_Ceramics
@@TaylorSparks so in that case would the characteristic strength be .00276? to find the characteristic strength, I did -17.047 = 2.8941*ln(characteristic strength), would that be correct?
Thank you for your video mate. Can I apply this approach for sand size distribution problems? For example, I plotted the cumulative mass % against the size of the particles. Am I able to see if my curve falls to Weibull distribution?
absolutely. A Weibull analysis simply assumes your data can be fit by a curve and then allows you to define that distribution with parameters that represent tightness of distribution (weibull modulus) and characteristic values etc.
I think I got the logic - I ranked the sieve size according to the cumulative percentage (the highest stress in your case is the sieve size with the highest cumulative percentage in my case) and then followed your steps. Many thanks for your help Taylor!
Hi! i'm a brazilian studant and i'm researching about geopolymer materials behavior. I'd like to understand more deeply the weibull distribuition. Can i contact you for e-mail?
is it possible to use this method to determine the time at which something will fail rather than the stress it fails at. Say i have multiple identical machines that runs for 24 hours and I have data on the number of hours it runs before failing can I use Weibull?
absolutely. The steps are the exact same. Instead of ranking your samples by the strength that which they fail, you will rank them by the time at which they fail. All the steps that follow are the exact same
Hello there. thanks for the tutorial...very helpful..but why did you chose 0.5 to estimate the failure (column F)... i found another website that suggested another formula F=(rank-0.3)/(population+0.4) and he calls it MEDIAN RANK...the latter method makes even less sense...do you have a way to optimize this calculation of this median rank? Nevertheless, you method is easier than the other tutorial i found Looking forward for your reply
Hello, both my method and the median rank method are both used to fix a problem with estimating failure rates. For example, if I left out my 0.5 term and I just used a rank divided by population then if I have 30 samples and I take my 30th sample and divide by 30 this would predict 100% failure. This is fine with my small sample set, but it's a big problem with reality. In reality, if I tested, say 1 million samples, the odds of having samples which fail above the stress of #30 are very high! Therefore, predicting failure rate of 100% at the stress of sample 30 was not reasonable. For that reason failure rank is modified to allow for realistic cases where more samples might be tested.
Hello again and thank you for the explanation. I totally understand the reason to modify failure rank. However, i still do not know how to chose that factor 0.5 used in the example...nor the 0.3 and 0.4 factors chosen elsewhere... are these factors still work for any size of tested population? in my case I have different populations with different sizes.. shall I get a factor for each? same for all?
@@3006spikespiegel to my knowledge you don't have to choose the factor 0.5, 0.3, or 0.4. you just select a rank formula. I think median rank is more realistic so it should probably be used but you don't need to modify your 0.3 or 0.4 values.
gotcha... and I realized why your method still works: if you sum the modified ranking in column F you get population/2...in the same way as ranked median (when summed it gives population/2)... i am not really sure why these parameters has to be population/2..i need to dig it further... but probably it has to do with this page where they estimate ranked median using Inverse Beta function at probability = 50% anyway, thank you very much for the videos ...your latter videos sent me back when i was student in metallurgy! keep on good job man!
I want to find out if a equipment failed x time within Y hours OF OPERATIONS what is potential probability of that equipment lasting z hours ? Example if Engine failed 14 times within 30000 Hours of operations, what is probabilities of engine lasting for 50000 Hours or at which hours it will fail ?
Do you have more than one data point? If you only have the one data point then I don't know how to solve this problem. If you have a large set of data then you would apply waibel probabilistics the same way that I have here
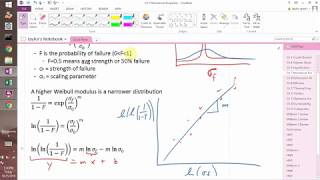
the shape parameter is the same thing as the weibull modulus. I describe it in this video ;) The scale parameter is typically defined by where the line intersects the x axis. Sometimes called the characteristic strength.
I have a question for you 🙋♂️ , in colleges and universities, which courses talk about Weibull Distribution? Which courses talk about that? Which courses? I would like to know this because I don’t know which courses talk about Weibull Distribution in colleges and universities. Please tell me which courses talk about Weibull Distribution in colleges and universities. Please tell me. Please make sure that you read my email and send a reply to me. Have a very nice day! 🙂


6 years later and you still saved my life with this. Might actually pass this lab
You just helped me understand Weibull distribution in your video. I am grateful
My pleasure!
Very helpful, thank you for making this video! You mentioned that 'charts don't need titles', when they literally ALWAYS do. It's a habit that should be hammered into people in all scientific fields.
Oof. I'll have to disagree. Captions, axes labels, legends yes, but titles certainly not. Here is the resource that I share with all my students www.mrl.ucsb.edu/~seshadri/PreparingFigures-February2020.pdf
Fast and clear. You know that he knows what he is talking about.
This saved me for my ceramics final thank you!
Super glad to help!
Wow thank you so much for saving my grade
Corin N Let me know what else I can help with!
@@TaylorSparks Hey Taylor, Thanks for the nice video. So, If I have to use the weibull.dist formula in excel, will the alpha be 2.8941 and beta be 17.047?
Excellent video nice explained
glad to help! like, sub, and share to help me grow the channel ;)
Thanksss! Very well explained, clear and easy (L)
Bonjour. Svp j'ai un problème sur Excel. La distribution ne semble pas reconnaitre les facteurs K et C comme paramètres (alpha et béta), mais comme valeurs normales, d'où elle les rejettent.
Dear Taylor, thanks for the video. However, could you plz explain the QQ plot for weibull distribution.
very helpful thanks!!!!
First of all. Thank you for the videos, very helpful. I was wondering how you would go about performing a Weibull analysis were the failure is time-based and not based on stress. Lets say you have a 100 samples that you tested cyclicly to determine the endurance limit. Only 20 samples failed and the other samples did not fail after 1E6 cycles. How do you go about saying something about the reliability of XXX cycles? I have calculated it too and would like to see your reasoning. Kind regards Gerhard
Well explained, Thanks so much.
Thank you for this video, please I have a question, how do we estimate the failure function, if I have the number of data exactly 20
Thank u so much, I have a question about "y" I saw there are different equations and it depends the number of data, I was reading a book that the equation it was y=(i-0.3) /(n-0.4) and gave me a different result from y=(i-0, 5) /n, I wish to know which is the best, my n=3
could you please show me how could I show different group's Weibull in a single graphs.
thank you
Hey Taylor, Thanks for the nice video. So, If I have to use the weibull.dist formula in excel, will the alpha be 2.8941 and beta be 17.047?
Same question
Thank you so much sir
Nice video, could you please help me to know how we can find Beta and theta value using MLE method in excel?
Thanks a lot
First of all, thanks for the video, excellent work. At the beginning you say to use at least 20 (experimental/observed values), is there any work that recommends this value?
I read the original article and there, Weibull presents example with 10 values. Some articles that I have read in Elsevier show results with 5/8/10 values.
So, I was left with this question.
Thank you again Professor.
This is a good article on the topic. Essentially, more samples is greater confidence. www.researchgate.net/publication/259388853_Influence_of_Sample_Size_on_Strength_Distribution_of_Advanced_Ceramics
@@TaylorSparks Thank you!
so good and simple explanation , thank you so much... how to do t test for weibull test , will appreciate if you can give a tutorial for that
sorry, what's a "t test"?
I need a two tailed t-test with p
@@olgameshch372 sorry! I'm unsure how to help with this. If you find a good resource post it here!
No worries 👍 thanks
Why is there an Airplane starting in the Background?
Lol. My old laptop had some heat management problems and I wasn't using an external mic that day. I've gotten better since :)
hello, very nice explanation. can you help me to teach about inverse weibull distribution function plzz
Is characteristic strength the same as characteristic life when doing a weibull using failure to time?
Yes
Thank you so much. This video is so helpful. What is the Characteristic Strength value? Is it -17.047?
Mike J close. Not quite. -17.04 I'd equal to modulus*ln(characteristic strength)
@@TaylorSparks so in that case would the characteristic strength be .00276? to find the characteristic strength, I did -17.047 = 2.8941*ln(characteristic strength), would that be correct?
@@mihotsubaki8892 correct.
Thank you for your video mate. Can I apply this approach for sand size distribution problems? For example, I plotted the cumulative mass % against the size of the particles. Am I able to see if my curve falls to Weibull distribution?
absolutely. A Weibull analysis simply assumes your data can be fit by a curve and then allows you to define that distribution with parameters that represent tightness of distribution (weibull modulus) and characteristic values etc.
I think I got the logic - I ranked the sieve size according to the cumulative percentage (the highest stress in your case is the sieve size with the highest cumulative percentage in my case) and then followed your steps. Many thanks for your help Taylor!
Hi! i'm a brazilian studant and i'm researching about geopolymer materials behavior. I'd like to understand more deeply the weibull distribuition. Can i contact you for e-mail?
Sure thing. I've worked on geoploymers before. Sparks@eng.utah.edu
is it possible to use this method to determine the time at which something will fail rather than the stress it fails at. Say i have multiple identical machines that runs for 24 hours and I have data on the number of hours it runs before failing can I use Weibull?
absolutely. The steps are the exact same. Instead of ranking your samples by the strength that which they fail, you will rank them by the time at which they fail. All the steps that follow are the exact same
Hello there. thanks for the tutorial...very helpful..but why did you chose 0.5 to estimate the failure (column F)... i found another website that suggested another formula F=(rank-0.3)/(population+0.4) and he calls it MEDIAN RANK...the latter method makes even less sense...do you have a way to optimize this calculation of this median rank?
Nevertheless, you method is easier than the other tutorial i found
Looking forward for your reply
Hello, both my method and the median rank method are both used to fix a problem with estimating failure rates. For example, if I left out my 0.5 term and I just used a rank divided by population then if I have 30 samples and I take my 30th sample and divide by 30 this would predict 100% failure. This is fine with my small sample set, but it's a big problem with reality. In reality, if I tested, say 1 million samples, the odds of having samples which fail above the stress of #30 are very high! Therefore, predicting failure rate of 100% at the stress of sample 30 was not reasonable. For that reason failure rank is modified to allow for realistic cases where more samples might be tested.
Hello again and thank you for the explanation. I totally understand the reason to modify failure rank. However, i still do not know how to chose that factor 0.5 used in the example...nor the 0.3 and 0.4 factors chosen elsewhere... are these factors still work for any size of tested population? in my case I have different populations with different sizes.. shall I get a factor for each? same for all?
@@3006spikespiegel to my knowledge you don't have to choose the factor 0.5, 0.3, or 0.4. you just select a rank formula. I think median rank is more realistic so it should probably be used but you don't need to modify your 0.3 or 0.4 values.
gotcha... and I realized why your method still works: if you sum the modified ranking in column F you get population/2...in the same way as ranked median (when summed it gives population/2)... i am not really sure why these parameters has to be population/2..i need to dig it further... but probably it has to do with this page where they estimate ranked median using Inverse Beta function at probability = 50%
anyway, thank you very much for the videos ...your latter videos sent me back when i was student in metallurgy!
keep on good job man!
@@3006spikespiegel glad it was helpful!
I want to find out if a equipment failed x time within Y hours OF OPERATIONS what is potential probability of that equipment lasting z hours ? Example if Engine failed 14 times within 30000 Hours of operations, what is probabilities of engine lasting for 50000 Hours or at which hours it will fail ?
Do you have more than one data point? If you only have the one data point then I don't know how to solve this problem. If you have a large set of data then you would apply waibel probabilistics the same way that I have here
@@TaylorSparks can you please explain what you mean two data point ? Please let me know what exactly we need to put something together
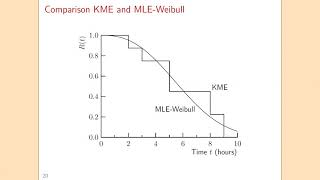
Is this the cumulative distribution function?
Plotting failure probability, F vs stress will give you that cumulative distribution.
Thanks
How to determine the shape parameter and scale parameter using excel?
the shape parameter is the same thing as the weibull modulus. I describe it in this video ;) The scale parameter is typically defined by where the line intersects the x axis. Sometimes called the characteristic strength.
hi. how do we apply this for 5 sample groups?
hmmm... I am not sure. You could combine the data from the sets or you could average weibull from the five sets I suppose?
@@TaylorSparks ahh. I am getting the #NUM! error after the y axis column gave 3 values.
How about the effect of volume?
ruclips.net/video/PIXooSlYd0o/видео.html
merci infinement ,plz comment on va trouver les parametres de wiebell sur excel,et merci d'avance
j'attends votre reponse
je suis interesse aussi
@@ayoubainouz7187
Cette vidéo explique comment on peut les trouver:voilà le lien de vidéo
ruclips.net/video/fdfrUTNazrM/видео.html
بسمة العلمي merci beaucoup basma ,j’ai arriver a determiner les parametre de Weibull .
@@ayoubainouz7187
Je vous en prie
You are les ZHOMMES Habibi!
👊🏻💪🏻👍🏻
I have a question for you 🙋♂️ , in colleges and universities, which courses talk about Weibull Distribution? Which courses talk about that? Which courses? I would like to know this because I don’t know which courses talk about Weibull Distribution in colleges and universities. Please tell me which courses talk about Weibull Distribution in colleges and universities. Please tell me. Please make sure that you read my email and send a reply to me. Have a very nice day! 🙂
Ceramics, processing statistics, possibly fracture mechanics?