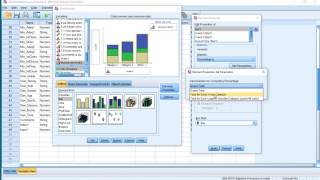
Instructional video on how to create a relative clustered bar chart in SPSS. Companion website at PeterStatistics.com Donation welcome at Patreon: www.patreon.com/bePatron?u=19...
Thank you! Thank you!! I totally forgot about the legacy dialogs. It is so hard because when go straight to the chart builder to make clustered bar graph, scale variables are not allowed. Thank you so so much!!
glad this relative older video (6 years ago) still helps. Luckily SPSS doesn't change much in the basics, so I don't have to re-create all my videos each year. Good luck with your career :-)


Thank you! Thank you!! I totally forgot about the legacy dialogs. It is so hard because when go straight to the chart builder to make clustered bar graph, scale variables are not allowed. Thank you so so much!!
glad is helped. On a side note, you can temporarily change a measurement level and then change it back after the analysis.
@@stikpet I'll try it then. Thanks!
Omg thank you
glad to help.
thankyou for saving my academic career LOL
glad this relative older video (6 years ago) still helps. Luckily SPSS doesn't change much in the basics, so I don't have to re-create all my videos each year.
Good luck with your career :-)