Scatter Plot - SPSS (part 1)

HTML-код
- Опубликовано: 27 окт 2024
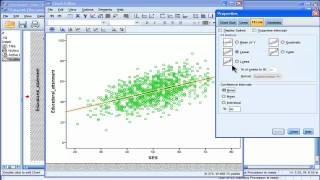
- Learn to create a scatter plot and modify it to help make it look good. Also, add linear regression line, as well as correlation (r squared). Finally, reduce gap (margin) between the edges of the x and y-axes.


I cant’t thank you enough for these videos, I would be working on my assignment for hours more without these, I love your explanations and I genuinely was learning. Thanks again!
What a genius brain this are the people we need in this society ....you have saved me BIG!
Thank you for your video..I struggled to show the graph in my seminar..your video helped me a lot ..Thank u very much
Our instructor is using you as a crutch. You should probably get paid part of her salary. Good videos.
Thanks man, much appreciated.
This helped me so much! Thank you
OH MY GOD THANK YOU SO MUCH I LOVE THIS VIDEO THANK YOU OMG I'M GOING TO PASS MY STATISTICS COURSE THANKS MARTIN VAN DER VELDE HEUHJJJJJJJ TERINGGROTE BROEK
PENS
IK HAAT AMOS
SPSS MASTERRACE
You can do it!
if we;'ve made a scatterplot of 2 datasets (both not normally distributed) compared with Spearman correlation, are we allowed to still put a linear line of best fit on the scatter plot?
Hello can u help me plz
very helpful sir
I liked it so much i clicked like 3 times :(.
thanks, it is very helpful!
I have a (maybe kinda stupid) question. I need to make a scatterplot and I have 5 variables (test 1, test 2, test 3, test 4, test 5). I should search if there is a correlation or not (and where) and I should start with making a scatterplot. Do I make 5 different scatterplots, or can I include all the tests in one scatterplot (by using a sumscore of the all the tests)? Thanks in advance!
Extra question: if I should have a scatterplot for every test, what do I put as X and Y?
hey there. I'm desperate because I seem to find no answer to my question. So here it is:
I've drawn an spss scatterplot with time on my x axis (hours) and values of my laboratory sampling on my y-axis. For my x-axis, I have very few values above a certain value of "200 hours", so rather than showing each individual value (which actually stretches my scatterplot a lot), I'd like to just specify "> 200 hours" on my x-axis. Is there any way to do that?
can we make a scatter plot for two likert scale variables to check relation between them? if yes how and how to interpret them. I would really appreciate your help.
+pallavi singh You can to some degree, but it probably won't look very good. If your likert scale has 5 or more points in it, you can use Pearson's correlation to estimate the association. If less than 5-points, then you can use Spearman's correlation.
Thanks!
it was so helpful, thank you