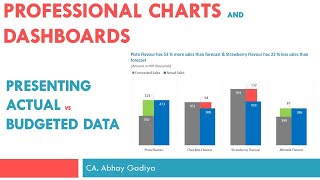
Presenting Budget, Actual and variance all in one chart itself

HTML-код
- Опубликовано: 15 фев 2020
- This video explains steps to create a combo chart which will display all the values for budget, actual and variance in a single column chart itself. It will dynamically change color for negative variance to red and positive variance to blue.


Excellent
You are tooooooo fast.......why are you so fast? It becomes very diffult.....so your tutorial is for 0.01% of excel users who are as fast as you......please be slow. Dear Abhay, but having said that, your explaination is outstanding........it was very diffult to find this video. Really Great work, Thanks so much