TABLEAU DONUT CHART TUTORIAL

HTML-код
- Опубликовано: 14 дек 2024
- Get Tableau Certified, guaranteed - www.artofvisua...
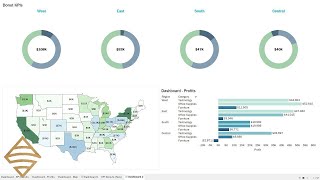
A donut chart is essentially a Pie Chart with an area of the center cut out.
However, Donut Charts have a slight advantage over Pie Charts, which are sometimes criticized for focusing on relative sizes of the pieces to one another and the chart as a whole, giving no indication of changes as a whole when compared to other Pie Charts.
A Donut Chart partly addresses this problem by de-emphasizing the use of the area, to make the viewer focus more on the changes in overall values. You are focused on reading the length of the arcs, rather than comparing the proportions between slices.
Also, Donut Charts can take up less space than Pie Charts by having their centers used to display information within their blank centers.
To stay up to date with our latest videos make sure to subscribe to this RUclips channel!


By far one of the best resources on this subject. Your style of teaching makes everything easier to understand. Thank you for sharing this with us.
the idea of making a calculated field 1 is AMAZING! Thank you so much for this video, helped me a lot
Love the video, but the volume is very low
Hi Stephen,
We will try to fix in next videos.
Thanks for your feedback
Thank you so much for this tutorial! The explanations were very helpful!
Hello
what if i want to color all 3 donout with diff colors based on percentage ??
how to achieve this ?
Very nice video on Donut chart and bullet chart. Very informative, clearly explained, step-by-step. I greatly appreciate for uploading this video. Thank you.
Very helpful videos....Waiting for more new and interactive charts.
For some reason having issues with seeing the entire donut on dashboarad no matter how I set the fit - Standard, entire view, fit width, donut always outside of box
Nice work brooooooo..
Why are there still no default donut chart in tableau *rolling-eyes*
Amazing tip, thank you!
Thank you for your tutoriels so great!! Waiting for more please
Every week Nawal!
Hi, nice tutorial thanks! Is there a way to conditionally format the blue bar with green/red based if over/under target?
Hi J R, To do this you can simply add a calculated field which determines whether the value is over or under target. You can then use this calculated field on the colour options for the chart.
Hrm it's really proving harder than I thought... So using your example, I was hoping to get the Blue portion of the Donut which represents "Sales" as Green or Red based on +/- Target. I was then hoping to fill in the Orange portion of your Donut as grey which represents the "Sales Remaining"
I've been trying to make an IF statement to use as the filter on the "Colour" tab of the Donut which I thought should be -
If Sum([Sales]) >= Sum([Sales Target]) then "Green"
Elseif Sum([Sales]) < sum([Sales Target]) then "Red"
Else NULL END
That formula ends up colouring the whole Donut though so then I can't see the colour split between the Green/Red portion of "Sales" vs the Grey Colour of "Sales Remaining" if that makes sense?
So then I thought maybe I need to add in a condition for the "Sales Remaining" portion of the Donut as well. My new IF statement to try and capture the Grey "Sales Remaining" portion was -
If Sum([Sales]) >= Sum([Sales Target]) then "Green"
Elseif Sum([Sales]) < sum([Sales Target]) then "Red"
Elseif [Sales Remaining] >= 0 then "Grey" else "Grey" END
If I drag onto the "Colour" tab, it's still only bringing "Red" or "Green" and colour the whole Donut... I'm rather stumped so any help is greatly greatly appreciated if you have any wisdom :) ?
@@JR-sl6pq Hi, my friend! That's ok? Have you solve your question? I have the same problem.
This is really helpful. Can you create a tutorial for creating speedometer please?
Hi Kather, thanks for your suggestion. We will think about it :)
SuperDataScience thank you 😊 looking forward to it
Kather, check out our tutorial on creating a clock face: ruclips.net/video/b_X71QgOD9E/видео.html. It can easily be adapted to function as a speedometer.
Wow! Many thanks! I'll try if I will be able to create the speedometer using this.
Good and clear steps shown in video!
Thanks for your feedback Christie!
you can fix the above 100% limitation using an if condition
Thanks for this tutorial! It literally saved hours of me stressing out :D is it possible at all to put an icon in the middle of the chart?
Hi xderbs, with a small "hack", yes. You can simply place a picture object onto the dashboard, but using the _Floating_ layout option for the picture. This way you can resize and move it around without any restriction or impact on the other charts.
Brilliant, I will give it a try, thanks :)
Cool, circle over circle.
Thanks for tuning in!
good tutorial. thanks
great video thanks for sharing.
You are most welcome Jean :)
Very nice
Very helpful. Thanks a lot
Useful stuff...Thanks
thank you so much, it works
You are most welcome Khuslen!
This is so helpful !!
thanks
Thanks for watching us!
really awesome, thanks
Saved my life!!!
very nice.
thankyou. it's very helpful :)
Thanks for tuning in Anne!
Can we have Stacked donut charts?
Hi Kapil, what do you mean by Stacked donut charts?
I can't hear anything :-(
u talk so fast