Sankey Diagram in Python Made Easy!

HTML-код
- Опубликовано: 8 фев 2025
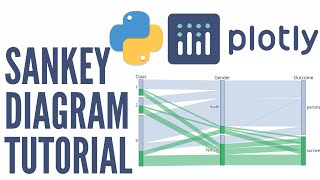
- This video will show you exactly how to create amazing Sankey diagrams in python quick and easy! You will learn what a Sankey diagram is, how it is useful to show customer movement and migration over periods of time (most helpful to see this between pre, during and post periods of a campaign), and how to interpret them.
We will show and explain all code so that you can make custom Sankey diagrams of any number of periods, custom colors for the links to best show and differentiate them and more. The video steps through the code in a way that anyone (even those relatively new to python) can recreate these amazing and very insightful graphs.
If you are looking to break into data science or data analytics there is no equal to the Sankey diagram. The number one thing business executives are looking for and to measure or visualize is customer engagement. How did a campaign or coupon increase customer engagement? What long term effect did it have on the customer's that redeemed said coupon? Nothing shows this better than a great Sankey diagram.
This is a graph that should be in every data scientist and analysts portfolio along with the plotly library. This one graph opens doors that you cannot believe. There is a reason for that. The math behind Sankeys is rough - think 3D and 4D inverted chess or worse. This video shows you how to avoid all that and start making amazing sankey diagrams and showing customer engagement and migration or movement today!
I hope you found this video both insightful and educational.
Please take a moment to subscribe, like and share so you won't miss future great videos like this one!
Thanks again and God bless!


This video was by far the best one on the subject and very helpful. If I could add something to it that might help other people, would be creating a "color_node" variable like you did for the links:
color_node = ['#EBBAB5', 'etc', 'etc']
node = dict(label = label, pad=35, thickness=10, color=color_node).
This way you can control everything on your plot.
Super easy to follow along and sincrely helped my workflow today. Thanks a ton!
made it so easy to understand. Thank you
Hey, Thanks for this. Great tutorial. Managed to modify what you started with to spread deom 3 sources to 23 targets. Noe of to find how target 4 can be the source for the next step in the chart. I have a depth of 3 on my Sankey. I have seen it done but to as easily explained as you did.
Thanks so much for this tutorial, it's the best I could find, well done!
Thank you for your kind words! Since I was a little boy my father instilled in me the idea of helping others do good, be good. This is my way of giving back and helping others. I work as a data scientist at one of the top companies for data science, analytics and reporting - PeaPod Digital Labs. As I have time I take real processes and ideas that we actively use and teach them on this channel! Be sure and subscribe so you don't miss any as I usually create and publish 2 - 4 new videos each month as I have time. Thanks again and God bless!
import plotly.graph_objects as go
label = ["High", "Medium", "Low", "High", "Medium", "Low", "Lapsed"]
source = [0, 0, 0, 0, 1, 1, 1, 1, 2, 2, 2, 2] # 3 source nodes
target = [3, 4, 5, 6, 3, 4, 5, 6, 3, 4, 5, 6] # 4 target nodes
value = [548, 571, 129, 76, 303, 1537, 564, 189, 722, 1684, 1531]
color_link = ['rgba(31, 119, 180, 0.8)', 'rgba(255, 127, 14, 0.8)', 'rgba(44, 160, 44, 0.8)',
'rgba(214, 39, 40, 0.8)', 'rgba(148, 103, 189, 0.8)', 'rgba(140, 86, 75, 0.8)',
'rgba(227, 119, 194, 0.8)']
link = dict(source=source, target=target, value=value, color=color_link)
node = dict(label=label, pad=35, thickness=10)
data = go.Sankey(link=link, node=node)
fig = go.Figure(data=[data])
fig.show()
# Here is the code
Could you please add a link to the notebook or source code please ?
Very easy to follow. Thanks.
Glad it was helpful!
Hey man thank you, you are a life saver!!! Everything worked as you said
Thank you for your kind words. My philosophy is that education should be free regardless of location or resources. I provide these free video tutorials so that anyone that wants to learn can benefit. Please help spread the word so mord can benefit. Thanks again and have a great day. :)
@@techknowhow4802 The documents cover all this but you made it into an easy launchpad for complete beginners. I may have to tweak the orientations a bit if a situation arises where intermediary nodes need to be drawn, but I'm confident that I'll figure it out with the basics nailed down now. Thanks once more.
This tutorial is great! I was able to apply it to my work. I have a question, is it possible to add another target field to the right? Any tips on how to do that? thank you!
Great tutorial! Thanks for sharing :)
Glad it was helpful!
What about a multi-level Sankey (more than 2 levels)?
Love It!
Thanks heaps for the tutorial! I have one question tho. How did you change the background color of the label text to white, while your standard background color is this dark grey?
Nice.
I get that plotly is mostly interactive but i have been struggling with trying to get the values being plotted along the links. to see the actual numbers when i save the plots.Do you know how to do that.
I gonna impress my superiors with this.
Managers and executives all love the Sankey diagrams. :)
Great explanations! Thank you! I am looking to build a diagram that adds on to an existing, for this example say they run another coupon cycle, how do the nodes get laid out for this? Thank you.
edit: Just watched your older Sankey video as well, also great! In that video you had 4 nodes per month "group" that linked to the next group, so that even if the node sizes changed the flow direction stayed the same so the group nodes lined up. I'm looking to have nodes that dead end, or start fresh with each group (new customers, or customers that have left). How can I keep those nodes lined up with the desired group? Maybe link to a previous node with a 0 value? Thanks again.
When I have time I will post a solution with 3 periods. Basically its like 2D versus 3D math. Each period you add increases the complexity exponentially. :)
In this the lines are overlapping, I want all the overlapping lines to stay visible what changes do we need to make in the code?
I had a problem when I am running the data = go . sankey.
It shows the module abject is not callable.
Can you please help me?
You need to make sure you loaded Plotly correctly first. ($ pip install plotly...) Also look at your python version. Make sure you have the latest version. The code to load plotly correctly is shown early on in the video. If it doesn't load correctly you will get all sorts of weird errors like uncallable modules. Be sure to check out the other helpful python videos I have in this python playlist: ruclips.net/p/PL6jrK3SnmfuDskCTaV4FdaJf0Pu5RhitS
Hi Tech Know How - I am exporting this into a pdf and I want to show the values of the lines from each node - how do I show labels and play around with formatting in jupyter?
I have similar question. Looking at the go.sankey document i havent found it. The only thing that comes close, is defining 'label' for the the link which is a list of string of values. But it is only when its hovered in the link.