I'm actually taking AP Statistics right now and i don't understand the explaination of my teacher. After wathching your video i finally understand everything. THANK YOU SO MUCH!!! MORE POWER!!!
Ms. Koenig, I just wanted to thank you for posting this video. I am going back to school after 30 years and my textbook did not clearly describe how to construct this table. It is an online college and the availability of the professor is limited. You do a wonderful job of explaining everything clearly. If an old goat like me can get it, anyone can. Thanks again.
Thank you for the video. I'm taking online classes and I couldn't figure this out. Having someone explain it to me as if I was in class learning the information for the first time really helped out! I understand what to do now :)
Excellent video. I have a practice midterm due today (Statistics) and my actual midterm due next week. This refresher lesson is easier to understand than my text and math videos combined, and was actually fun to watch and learn here. Great job! And thanks. :0)
you're the best ! my college professor expects us to do it on a calculator but didn't take the time teach us how to use it. so now I'm here learning manually.
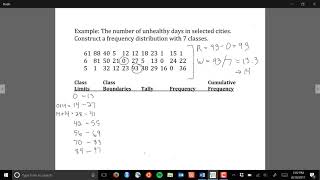
@angelone211 You do still use the rules if your data is in decimals. The class width you find by (largest-smallest)/number of classes round up to match the number of decimals as the data. Then start your first class lower limit with the smallest data value, add the class width to that number to get the lower limit of the next class etc. The class boundaries will be one more decimal place than the data.
Hey Mam thank you so much , you really can't imagine how grateful i am you made me understood something i couldn't undrestand more than 5hours in five minutes thank yo again
To approximate the mean if you only have the frequency distribution you: 1) multiply each midpoint by that class frequency for each class 2) add all the answers you got in step 1 3) add all the frequencies 4) divide the number from step 2 by the number from step 3 This is just an approximation of the mean since you didn't use the individual data values but the approximation is still useful.
I've been trying to decypher my applied statistics book for days. This was immensely helpful. How can something so straightforward be made so difficult... Thanks!
@rvcmathprof Here is an example with just a few numbers: If you are asked to make a frequency distribution that has 5 classes with the data 12.4 11.9 17.9 11.5 13.7 17.0 22.1 19.5 18.4 15.3 class width=(largest-smallest)/5=2.12 (for class width round up to the same decimal place as the data) round to 2.2 You can start your first class with a lower limit being the smallest data. Then the second class lower limit is found by adding the class width to the previous lower limit
I just stop solving mine cause our teacher said that the highest limit in the example should be the last in highest limit like in your example 46 was the highest but you put 49 in it. JUST A BIG THANK YOU FOR THIS VIDEO! I thought I'm doing the wrong way. God bless!
I've watched two of your videos and they are VERY helpful. You explain very clearly. Might I suggest adding a sequence number in your titles, as I first went to the Frequency Polygon video, but it made little sense until I just used this Frequency Distribution video. Just a thought, but I will subscribe because these were VERY helpful! Thank you!


The best professors always explain things better. You explain this better than my professor. Thank you so much
5 years later, and you still explain better than my college professor :)
A million thumbs up to this lady, she explained it so well. Thank youuuuu.
You did such a wonderful job. This was a lot better explanation than I got from my college professor. You made it so easy!!
No joke, I was thinking the same thing!
This lady is a life saver
Thank you so much Professor. You saved my day! This and the previous video "Frequency Distribution, finding the class width".
You are the best at teaching statistics, I wonder why my professor wouldn't explain it this way. I had trouble trying to understand.
YOU EXPLAIN VERY WELL. Now I can do my stats homework very easily
Diane, you have helped me out tremendously. Thank you for uploading these videos and making it very easy to understand these processes.
I'm actually taking AP Statistics right now and i don't understand the explaination of my teacher. After wathching your video i finally understand everything.
THANK YOU SO MUCH!!! MORE POWER!!!
maam, Thank you! haven't taken a math class in 15 years. Your video broke it down to where I understand
Thank you Diane you have taught be more then my own Professor. THANK GOD FOR YOU
Ms. Koenig,
I just wanted to thank you for posting this video. I am going back to school after 30 years and my textbook did not clearly describe how to construct this table. It is an online college and the availability of the professor is limited. You do a wonderful job of explaining everything clearly. If an old goat like me can get it, anyone can. Thanks again.
Amazing channel. Will definitely make learning stats much easier for me. Thank you.
THANK YOU THANK YOU! IF YOU ARE AMAZING! I WAS ABOUT TO GIVE UP!!! GOD BLESS YOU IN EVERY WAY!!!! KEEP TEACHING AND TUTORING US WE NEED YOU!!!
thank you so much for making my concept about class limit clear! It's the easiest way to teach classes
Thank you for the video. I'm taking online classes and I couldn't figure this out. Having someone explain it to me as if I was in class learning the information for the first time really helped out! I understand what to do now :)
Thank you so much. I learned this crazy thing with you and I understood how easy it was. Thanks a lot!!!!
Thank you so so much... You are a life saver... It was my exam tomorrow and I couldn't understand it... Thanks again...
Thank you very much for your math tutorial videos! life saver!
Wonderful job! Very helpful during online classes due to COVID
Thanks, Diane you are a life-saver!!!
So glad it helped!
Excellent video. I have a practice midterm due today (Statistics) and my actual midterm due next week. This refresher lesson is easier to understand than my text and math videos combined, and was actually fun to watch and learn here. Great job! And thanks. :0)
definitely subscribing!! this helped a lot, thank you very much for this :)
you're the best ! my college professor expects us to do it on a calculator but didn't take the time teach us how to use it. so now I'm here learning manually.
Thank you so much.. you just made my sophomore year in high school a bit easier :)
this is great, much much better than listening to my prof.. :) Bigger change that I'll pass my exam. :) Thank you ma'am.
Loved the video! So much help!! Thank you!
Thank you so much, Ma'am! This is exactly what I needed! :D
Oh my gosh thank you so much, you enlightened me =)) I was absent when our teacher discussed this. Thank you sooo much ma'am
@angelone211 You do still use the rules if your data is in decimals. The class width you find by (largest-smallest)/number of classes round up to match the number of decimals as the data. Then start your first class lower limit with the smallest data value, add the class width to that number to get the lower limit of the next class etc. The class boundaries will be one more decimal place than the data.
thanks Mam Koenig... you explain much better than my teacher... your video is really helpful...
i prefer it when they do it by hand. they do not rush and leave out important steps. way to go.
Thank you so much! I really needed the clarification.
Thank you SO much. freakin love you
Thank u so much PROFESSOR DIANE R KOEING ,it was my first lecture and i learned a lot about frequency distribution from ur lecture
Thank you so much! You helped a lot!
Great video! Thank You!
You're such a great teacher
Thank you so much! You make it so much easier than my professor!!!
Hey Mam thank you so much , you really can't imagine how grateful i am you made me understood something i couldn't undrestand more than 5hours in five minutes thank yo again
Brilliant professor!
To approximate the mean if you only have the frequency distribution you:
1) multiply each midpoint by that class frequency for each class
2) add all the answers you got in step 1
3) add all the frequencies
4) divide the number from step 2 by the number from step 3
This is just an approximation of the mean since you didn't use the individual data values but the approximation is still useful.
thanks for your help! i dont know what i would have done without you lol
Thank you so much for this 🙏
got test tomorrow! thanks to you, i have now understand this part
thank you so much Diane R Koenig
i Completely understand and I Love you you solve my big patient
Way better teacher than mine. Thank you!!
This really helped me. Thanks!
SUCCINCT! AMAZING!
This is so helpful! Thank you so much!!!!
Thankyou you do a wonderful job now i can pass test 🤓🤓👍👍
You explain it clearly thanks
So glad I helped! Thank you for the feedback.
love you,u r the best!
Thank you for your video. You helped me understand my Math 153 class. Great Job teaching.
SAVED ME FOR MY ASSIGNMENT!
God bless you thank you !
suuuuper awesome videoooooo. thank you!
Thank you so much!
great video thanks !!! keep on posting
Nice saved my life on this project lmao thank god
Thank you for this video. You explained very well.
I appreciate the feedback:)
Thank you math Goddess
Very good!
Great explanation! Thank you!
I've been trying to decypher my applied statistics book for days. This was immensely helpful. How can something so straightforward be made so difficult... Thanks!
Just thank you!
thank you this video was helpful! i am doing an online math course and was confused by the book explanation. Liked the set up and simplification.
Thank you so much, I love you.
Thanks do mucch, your really good at explaining steps!;)
@rvcmathprof Here is an example with just a few numbers:
If you are asked to make a frequency distribution that has 5 classes with the data
12.4 11.9 17.9 11.5 13.7 17.0 22.1 19.5 18.4 15.3
class width=(largest-smallest)/5=2.12 (for class width round up to the same decimal place as the data) round to 2.2
You can start your first class with a lower limit being the smallest data. Then the second class lower limit is found by adding the class width to the previous lower limit
I am from india , thankyou mam for this beautiful explanation
This helped me so much thank you
omg! you made it simple. I've been avoiding math because its one of my challenges and this video helped me. Thank you!
I am so glad you found it helpful! I hope more of my videos will aid you as you continue through your course.
THANK YOU VERY MUCH!!!!!!
Nice and clear explanation...
Thanks so much for the shared knowledge
My pleasure
Thank you so much, you have helped me so much with this lesson
Thank YOU!!!
Thanks !! I got what I want to know !!
if it wasnt for this video i dont think i would have understood how to do the math lol thank you so much
A good and clare exercise - easy to follow
Great lesson, thanks.
got it!! thank u so much . i think im ready to take my first test..
very well said thanks a lot for this :)
I just stop solving mine cause our teacher said that the highest limit in the example should be the last in highest limit like in your example 46 was the highest but you put 49 in it. JUST A BIG THANK YOU FOR THIS VIDEO! I thought I'm doing the wrong way. God bless!
Thank you so much.
Omg! This lady just saved me
Your videos are very helpful.
Thank you, that was clear and helpful
Nice Your awesome !
Thanks Ma'am!!
Thank you!
YAAAAAA!! bravo
Excellent video this really helped me my test is in 20 mins
I've watched two of your videos and they are VERY helpful. You explain very clearly. Might I suggest adding a sequence number in your titles, as I first went to the Frequency Polygon video, but it made little sense until I just used this Frequency Distribution video. Just a thought, but I will subscribe because these were VERY helpful! Thank you!
View Frequency Distribution, finding the class width before viewing this video.
miss thanks so much
Thank you so much for explaining it so clearly! how i wish you're my statistic teacher! :D
What is Array data and then frequency contribution?
Thank you!!!!
Very good madam .thanks a lot ...
Indeed a math Goddess I finally understand thank you thank you thank you
Thankyou Very Much!