Monitoring Vegetation Health & Stress with Vegetation Condition Index (VCI) Using Google Earth Engin

HTML-код
- Опубликовано: 17 сен 2024
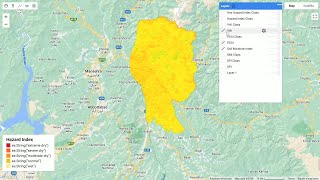
- Understanding Vegetation Health: Mapping Vegetation Condition Index (VCI) in Lahore & Chichawatni, Pakistan:
Variable Initialization:
HandsomePakistani:
An object containing visualization parameters for the VCI (Vegetation Condition Index) layer, including bands, opacity, and palette.
LearnGeographyGISrsWithAI:
A variable storing a FeatureCollection representing the area of interest (AOI) shapefile for Lahore, Pakistan.
modisgeographywithai:
An ImageCollection containing MODIS NDVI data.
ScaledMD:
An ImageCollection obtained by mapping a function to divide NDVI values by 10,000, representing the scaling factor used for MODIS NDVI values.
NDVI Visualization:
Filtering MODIS NDVI images for a specific month using ee.Filter.calendarRange().
Calculating the maximum and minimum NDVI values for the selected month.
Adding NDVI layers to the map with a specified palette using Map.addLayer().
VCI Calculation:
Filtering MODIS NDVI images for a specific year and month.
Computing the VCI by subtracting the minimum NDVI from the NDVI for a given year and month, then dividing by the difference between the maximum and minimum NDVI.
Determining the minimum and maximum values for VCI visualization.
Updating visualization parameters for VCI layer with auto adjustments.
Adding the VCI layer to the map using Map.addLayer().
Function for VCI Calculation:
Defining a function VCI_PakistaniGeographerfunc() to calculate VCI for each image in the ImageCollection.
Filtering MODIS NDVI images for a specific month inside the function.
Computing NDVI minimum and maximum values.
Calculating VCI and renaming the band.
Copying properties from the original image to the VCI image.
Adding Legend and Title:
Creating a legend panel to display VCI color representation.
Adding legend items for different VCI levels.
Adding the legend panel to the map.
Setting a title for the map.
Scale Bar:
Defining a function updateScaleBar() to update the scale bar text.
Calling the updateScaleBar() function when the map is clicked.
Creating a scale bar panel.
Adding a scale bar label to the panel.
Adding the scale bar panel to the map.
Extra Part (Chart and Console Output):
Creating a chart for NDVI over time using ui.Chart.image.series().
Printing NDVI and VCI values to the console.
Each part of the code contributes to visualizing and analyzing MODIS NDVI data, calculating the VCI, and presenting the results on the map with a legend, title, and scale bar. Additionally, it provides options for further analysis through chart visualization and console output.


Nice one Sir, please make videos on other indices also like TCI, VHI, SPI, SMCI, SVI... thanks
Thank you for your kind words and suggestion! I'm delighted to hear that you found the video helpful. I absolutely plan to cover other indices like TCI, VHI, SPI, SMCI, SVI in upcoming tutorials. Your interest and support mean a lot. Stay tuned, and I'll make sure to include those in the future. If you have any other topics or questions, feel free to share. Happy learning!
Going good
Sir we are waiting for your next videos ❤
Coming soon
code please sir
Code please sir
Thank you very much
SURE, Drop Your Mail
code pls,
Sure Dear, Drop me mail at alihasnainnokia4@gmail.com
3D 🫣
😄 Yeah 3D Look By Colors Game play
Sir there will always a easy method to share the code we not email you on each video
That defines your interest
Hey @kingkhan-qb5rj, thanks for your comment! I hear your point about wanting easy access to code.
My main goal is to create content for research students and support their deep learning. While I don't include code directly in descriptions, It's not about gatekeeping, but ensuring the code benefits those actively learning, not just casual collectors. That's why I'm happy to share it by email. This approach encourages engagement with the video and allows me to offer personalized guidance to those truly interested in applying the concepts. By emailing me at alihasnainnokia4@gmail.com, you can get the code and ask any specific questions you have.
I understand it might seem like an extra step, but I've found it leads to better understanding and application. I'm still open to exploring other options in the future, but for now, email is the best way to ensure the code reaches those who will get the most out of it.
I value your feedback and hope you continue to find my videos helpful!
Hey Dear ! Thanks for your comment! I'm glad you agree with the approach. It's important to ensure that those seeking the code are genuinely interested in learning and applying the concepts. If you have any questions or need the code for any of the tutorials, feel free to reach out anytime. Keep learning and exploring!
Best regards, Ali Hasnain @@Halal_hacks
*Promo SM* 🙋
Code please
sure drop your mail