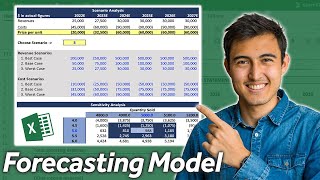
Dynamic Scenario Analysis for Excel

HTML-код
- Опубликовано: 11 сен 2024
- In this video clip, I demonstrate a technique to develop dynamic scenario analysis for Excel, in order to understand the impact on model result/s of changes to multiple input cells under multiple scenarios. The technique overcomes the limitations of the Scenario Manager which is found under the heading of "What-If Analysis" on the Excel Data Tab. The limitations of the standard Excel Scenario Manager are:
1) The routine exists outside of the Excel cells and it is a cumbersome process to change to change input cells under different scenarios in order to evaluate the impact on the model result for each scenario.
2) There is a limitation on the number of input variables (or "changing cells" as they are referred to in the Scenario Manager), which can be reached quite easily on more complex models.
By using a combination of the HLOOKUP function, Data Validation (list type) and Data Tables, this technique overcomes these limitations.
In order to clearly demonstrate the technique, the example I have used is deliberately simple (one would probably not use this for a simple model as the same result could be achieved by a grid structure with results at the end of each column). I have used the technique successfully for a number of more complex applications such as business valuations, project viabilities and financial budgets. In such applications, the final model result depends upon input from a number of other worksheets.
The technique can also be used to assess multiple results for each scenario, with multiple input variables. For example, I have developed a financial model with 6 scenarios, 20 input variables and three results per scenario (e.g. NPV, IRR and Profitability Index). I have tested the results against separate static models for each scenario and I get the same results, so I am confident in the integrity of the technique. There are a few basic rules to follow:
1) The input variables must be values.
2) The scenario table, the data table and the model result formulae need to be located on the same worksheet. It is fine to link the input variables to other worksheets.
The technique can be used for virtually any Excel model and has multiple applications. Although I believe that is preferable to commence model development with the specification of the scenario analysis, as this structures the thought process in terms of selection of key input variables and model result/s, the technique can be easily retro-fitted to existing models.


i used this technique in our band of scenarios regarding the purchase, construction and financing of a build to suit with desired return cash on cash and break even point. my supervisors were impressed at how quick i could present alternatives.
thanks.
Thanks Murray, this is a great video. You just saved me days of work! Great job!
BRILLIANT...much better than scenario manager!!
Thanks, Murray! I have been trying to figure out a way to build models in a more smarter way. Being at an entry level position at the office, this will really get the attention of the seniors. The composition of your table is quite insightful and gives me an idea of what I can do next. I guess that is the point of all teaching. Thanks again!
Thx Murray. Simple & sweet! Gr8 job
Excellent and very very useful video sir! it will help us a lot
Hi Murray... it really2x helpfull for the tutorial... hope you upload more video... and thanks you so much for the tutorial
You saved my Week! MUUUCH better than the Scenario Manager which is horror for hanlding scenario changes. I am really surprised that there is no third party tool to make that more convenient; something like exporting scenarios to table format and then re-importing them.
Anyway - your approach may actually be better than such a tool.
One note: the table can even be used for goal search of input values!
its amazing to learn from you - Keep sharing such wonderful concepts. Not everyone gets an opportunity to work on these scenarios; but nothing stops from learning!!! Nice efforts, thanks again.
Thank you! This is exactly what I am looking for
Hi Murray, this technique is just awesome, thank you very much for sharing.
Fantastic - thanks Murray!
Perfect work 👌
You are EPIC
Amazing video, thank you sir
Thank you!! This helped a lot!
If you use index/match instead of hlookup, then as row reference numbers you can use the "name of the position" column (units sold etc), you don't need the column with row numbers
Nice bro! You help me do sensitivity and scenario analysis homework :DDDDD
Exactly what I was looking for... well explained and so easy to implement. The model is only for one year, what if I have multiple years and wish to have different scenarios for it? Can you help. Thank you so much Murray.
I‘m trying to do the same for multiple years - wondering if you were able to figure it out?
@@PrynceOrgie44 the net profit result here for each scenario runs horizontally across the page. If you transpose this to have all scenarios listed in a single column, you could then make the table return the result for each scenario to the right, and run that for multiple years. When completing the data table (11:10) you need to then choose column input instead of row input.
Very nice.
it was very interesting, but could the scenario table be done using CHOOSE function?
how the final table could be done if you would like to see the NPV , IRR and the TOTAL REVENUE changing at same time? can you share an example ? many thanks
Hi Murray - thank you so much for this tutorial - definitely the most dynamic way I have seen that is what I am looking for. My question is how to get multiple outputs. Here you just use net profits, but I have about 50 results that i would like to show, is there a way to do this without running it over and over in separate cells? Thanks!
Thank you Murray, this is extremely helpful. I have a question: instead of solving for one point-in-time variable (net profit in your example), is it possible to solve for a variable for a range of years (or any other period) for budgeting or financial modeling?
At 6:59 seconds you mention that you have provided reference points. I am trying to reproduce the equation without success.. I believe it to be due to the row_index_num. Could you please explain the step you had taken before with reference points..? Many thanks.
Thanks for sharing, I am trying to build a model that leverages the scenarios but would like the underlying data to be captured in a table that updates as the underlying scenario is changed. Is that possible?
Hi Murray, thank you for this tip, its very usefull. I need to add some more complexity and I would like your opinion. The data table works perfect when you have one result each set of variables, but what when you have 2 or more results for each set of variables?
I see that you trick excel to show one result with multiple variables and multiple scenarios, but can you trick excel to show multiple results? (keeping it dynamic).
Erick Lange Hi Erik, thanks for the feedback. Multiple results are easy to develop, just add another data table with similar structure but reference to a different result cell in the model. The data table should be on the same worksheet as the original data table and the scenarios.
Does that answer your query?
Murray Saunderson Murray, I can't figure it out, can you show an example?
Murray Saunderson I was able to do it but maybe in a different way. As you have an hlookup for the row with the input data, I added a vlookup for the results and it works wonders. Thank you.
Would you like to share the file please, Many thanks in advance
Meanwhile I even struggle changing the font size.
I just read you full text under the video, so you can do it. Can you post an example?