Origin Tutorial 4: Creating Histograms & Fitting Gaussian

HTML-код
- Опубликовано: 30 июл 2024
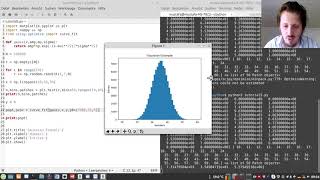
- In this video, I am explaining, how to create a histogram using randomly distributed data and how to perform a Gaussian fit that describes the data.
- - -About Origin- - -
Origin is an interactive computer program widely used for interactive data analysis. It can import a large number of different data files and process the data by using modern statistical tools and complex built-in fitting methods.
🔔 Subscribe for more content:
/ @physics_matters
- - -More Videos- - -
▶️ Playlist: • Origin Tutorials
- - - Social Media - - -
👉 Twitter: / mattersphysics
👉 Discord: / discord  Наука
Наука


Are you working in academics or industry?
Thanks a lot. Very useful tutorials👍
nice work
Thanks....please complete origin series
Dr. Mustafa, Maybe this isn't such general question. Can you make a video about Fitting Data with Legendre Polynomials. Thanks in advance.)
hey mate!! could you help me? It is then w = standard deviation and the standard error is the one next to Xc that it would be the mean?? thank you!!1