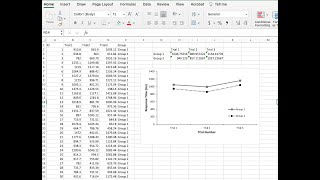
How to Make an APA 7 Bar Chart with Error Bars in Excel

HTML-код
- Опубликовано: 6 авг 2024
- This is a tutorial for making APA 7 style bar charts in Excel! Check out APA 7 guidelines here: apastyle.apa.org/products/pub...
Another helpful resource: owl.purdue.edu/owl/research_a...
Data used in the example: www.kaggle.com/datasets/ydala...


Thank you! This was super helpful :)
Thank you teacher
You are a legit life saver
So just double check the CI diff is essentially the standard error of the mean, right?
Standard error is computed by dividing the standard deviation by the square root of n. In this case, the standard error of "Less than 20" would be 3.05/sqrt(1819) = .07. Thus you would need to divide the "CI_Diff/2" column by 2 to get the standard error.
@@karyssa_ Much obliged
bro i haaateeee apa why do the bars have be grey and why do we have to write out numbers under 10 its like they want the information to be hard to access to reader like bro damnnnn psychologists are losers fr why did i choose to study with losers thats how im feelin today
Yes, they are just charlatans with a degree. But you can earn money scamming people.
man thank you for the tutorial but damn this is slow