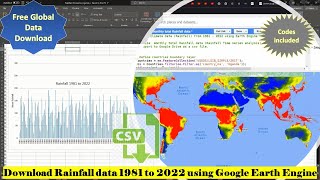
Earth Engine: Time Series Analysis of Soil Moisture with SMAP data | Export as CSV

HTML-код
- Опубликовано: 12 мар 2023
- Monthly Time Series Analysis of Soil Moisture using SMAP data and export result as CSV for preparing charts. Code Link: code.earthengine.google.co.in...
Code Link (Download in notepad): drive.google.com/file/d/1TKjt...
-------------------------------------------------------------------------------------
Join this channel to get access to perks:
-------------------------------------------------------------------------------------
MAP (Soil Moisture Active Passive) is a NASA mission that provides global observations of soil moisture and vegetation water content. The SMAP satellite carries two instruments: the L-band radar and the L-band radiometer. These instruments work together to measure soil moisture at a depth of about 5 cm and vegetation water content at a depth of about 1-2 cm.
------------------------------------------------------------------------------------
The SMAP soil moisture data is a product of the L-band radiometer, which measures the natural emissions of the Earth's surface at a frequency of 1.4 GHz. The soil moisture data is reported in units of volumetric soil moisture content, which is the amount of water in a given volume of soil, typically expressed as a percentage. The data is provided at a spatial resolution of about 36 km and a temporal resolution of 2-3 days.
------------------------------------------------------------------------------------
The SMAP soil moisture data is useful for a wide range of applications, including drought monitoring, weather forecasting, flood prediction, crop yield estimation, and climate modeling. The data can also be used to study the water cycle, carbon cycle, and energy balance of the Earth's surface.
------------------------------------------------------------------------------------
#googleearthengine #earthengine #SMAP #SoilMoisture #RemoteSensing #nasa #earthobservation #ClimateResearch #watercycle #agriculture #weatherforecasting #environmentalscience #naturalresources #dataanalysis #datavisualization #GeospatialAnalysis #bigdata #machinelearning #artificialintelligence #gis #hydrology #LandSurfaceProcesses #climatechange #sustainability #GlobalWaterCrisis #foodsecurity #CropYield #precisionagriculture #DroughtMonitoring #FloodPrediction #extract #csv


excellent
One of the finest lecture I have ever seen in RUclips
Hi Mr. Prem Kumar, Thanks for your valuable comments. Nice you hear from you, such comments motivates us.
Great video. Working. Thanks for the code
Thanks Mr. David.
Excellent 👌
Thanks for your nice presentation. I really appreciate it.
Thanks a lot for your wonderful and valuable comments.
Good one
Thanks Mr. Shaw
Thank you very much such a wonderful tutorial. My question is , is it possible to use this data for publication purpose without field data?
how to clip the visualization to shapefile ?
what the unit of output values
Sir, Image classification using earth engine video?
Lot of application for SMAP data
Sir, I’m trying the same process with study area as *India*, I’m getting an error that says
FeatureCollection (Error)
Error in map (ID=80)
Image.reduceregions: Image has no bands.
How do o fix this?
Code is perfectly working. Change country name from Sudan to India to acquire the Soil Moisture Index. Please refresh or reload or open new tab or check internet connectivity to avoid such errors.
@@TerraSpatial sir, I’ve tried and successful ✅. Can i run the data for 2016 to 2023/2024, sir?
@@nemboihaokip9575 Congratulations for successfully running the codes 👍. The datasets are available for 2015 to 2022 August, for more details please visit developers.google.com/earth-engine/tutorials/community/anomalies-analysis-smo-and-pre