Это видео недоступно.
Сожалеем об этом.
QGIS: Reservoir volume from DEM - Kajaki Reservoir, Afghanistan

HTML-код
- Опубликовано: 14 авг 2024
- How can I find the volume of a reservoir or lake from a DEM? In this video we will calculate the elevation-area-storage capacity for the Kajaki reservoir, Afghanistan from the SRTM30 DEM. We will use data from a 2006 bathymetric survey, which used an arbitrary datum, to find the elevation-volume relationship below the SRTM30 water mask, and then combine the two data sets together in Excel. I will take you step-by-step through all the processing from the DEM to the final elevation area-storage capacity curves.
Chapters:
00:00 Introduction
02:13 Step 1: DEM to Equal Area Projection
03:45 Step 2: Create contour lines
04:19 Step 3: Select maximum flooded area
07:13 Step 4: Edit maximum contour line
15:11 Step 5: Contour line to polygon
16:00 Step 6: Extract reservoir DEM
17:11 Step 7: Calculate Elevation-Area-Volume
21:13 How to get the DEM below the SRTM water mask
22:14 Step 8: Excel processing
25:20 Final remarks
Disclaimer: This video is based on open source data & the purpose is to train you in QGIS & Excel. I am not responsible for what you do with this information/methodology. You need to check you own data, work and conclusions.
*******************************************************************
Link to Kajaki reservoir data on Google Drive used for this video:
QGIS shape files & Reservoir DEM: bit.ly/3Lc70Ws
EXCEL data & calculations: bit.ly/3unSTaz
*******************************************************************
Some useful links:
Link to the 2007 USGS report on the Kajaki reservoir: pubs.usgs.gov/...
Link to video on Reservoir Elevation-Area-Storage Capacity Curves in Excel: • Excel: How to add a 2n...
For more QGIS videos see the QGIS playlist: • QGIS 101
Images used under Creative Commons License
Bathymetric survey
Australian Government Australian Transport Safety Bureau, CC BY 4.0 creativecommon..., via Wikimedia Commons
Source: upload.wikimed...
#QGIS #VolumefromDEM #Reservoirs


As an engineering student specializing in hydrosystems management, your channel is the best thing that ever happened to me !
Thanks for your kind words! All the best, Andreas
I'm so glad that I got to know your channel!!!
Welcome!! All the best, Andreas
Exactly what I was looking for. Thanks so much!
You are most welcome! All the best, Andreas
Please do more videos on geology topics,we r waiting , loved ur explanation.
Hi MALLIKARJUNASWAMY, This video is about a reservoir, but you can use the exact same methodology to work out the volume of a groundwater recharge basin, or an opencast mine. You could even use this approach to figure out the volume of a landfill or other positive topographical feature like a hill. What I would like to say is that all topics dealing with water are in the same family. We should not think that groundwater is separate from surface water. Many of the methods can be used for other parts of the water cycle as well. All the best, Andreas
This is Brilliant! Concerning the amount of repetitive commands it might be probably worth to either write a little plug in with python or so. That creates the table depending on z value. Maybe there is even already a plug in that we don't know
Hi Tom, Glad you liked it. If you find a faster/better way do let me know! All the best, Andreas
Thanks for sharing your knowledge
It's my pleasure Cusco! All the best, Andreas
Thank you so much for the excellent work
You are very welcome Eng Ansari! All the best, Andreas
thank youuu! you helped me a lott!!
You're welcome! All the best, Andreas
Great tutorial thnx
You're welcome! All the best, Andreas
Thank you for this video .its amazing and very useful.i want to ask you if this method can be used for lakes upstream barrages in river reach or for dams only.
In theory yes, but I would be very careful with rivers as they are constantly changing their profiles, so I'm sure that the SRTM model of 2000 is very different from what it looks like today. All the best, Andreas
I am so glad to see your videos, but why you select Kajaki Dam for your working area?
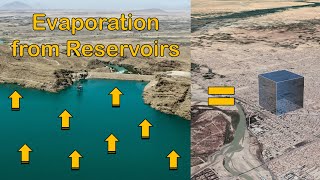
Hi Atiqullah, Kajaki is the most important dam in the Helmand River Basin & also there are some interesting studies already completed by the USGS. I wanted to see if they can be replicated using open source data. For example, see my video on the evaporation losses of Kajaki dam. All the best, Andreas
I think the results for your volume is 5100 MCM which is a large number compared to the actual reservoir capacity 1700 MCM.
Hi Habib, the maximum capacity @ 2 metres above the spillway is around 1485 MCM. That is an SRTM elevation of 1020m, or an arbitrary project elevation of 1035.5m. When we make the Elevation-Area-Capacity curves we will always include elevations which are way above the maximum fill level. In this case I have gone up to 1050m SRTM, which would give a volume of 5063MCM. Of course this is just theoretical. The reason for extending the curves is in case some politician decides that it would be a good idea to increase the dam height by "x" metres. I think there were some plans to do this for the Kajaki. If the curves are ready, it is very fast to see the impact of this in terms of flooded land area, and increased evaporation losses from the larger surface area of the reservoir. All the best, Andreas
Great video Mr. Andreas. Watching from Kigali, Rwanda. I am a dam engineer. Keep it up.
One Question: We are facing issues of measuring/estimating sedimentation levels/volume in our existing reservoirs such as the reservoir of Nyabarongo I hydropower project (location: -1.989096°, 29.633219°). Apart from Bathymetric survey, Any other method can you propose to us in the estimating sedimentation volume within a reservoir? Thx
Hi @africanahills2851 Glad you like the video! I have travelled through Rwanda many times en route to Bukavu in what used to be called Zaire. A beautiful country!
Regarding sedimentation issues in reservoirs, I think that is the most important issue after evaporation losses. Bathymetric surveys are expensive, but what you can do is to look at Sentinel satellite images and map the water area at different times, especially when the reservoir levels are going down in the dry season. That way you will see the speed of sediment build-up over the years. The best way to do this is via the Google Earth Engine, but you will need some programming skills. You could also do drone surveys if you need more details.
Have a look at: Guidelines for Developing Reservoir Sedimentation Monitoring Plans
www.usbr.gov/tsc/techreferences/reservoir/GuidesForDevReservoirSedimentationMonitoringPlans_09-2021_508.pdf
Reconnaissance Technique for Reservoir Surveys
www.usbr.gov/tsc/techreferences/mands/mands-pdfs/ReconnaissanceTechniqueResSurveys04-2006_508.pdf
Good luck & all the best, Andreas
@@GeosearchInternational Great quick feedback and explanations. I will go through the shared material/documents. Thx a lot. I appreciate your contribution
You are most welcome! All the best, Andreas
1) Is it ok that I got a different result than yours while calculating surface raster volume? Is it because the SRTM images that we import from the plugin are of different time?
2) What does 'count only below base level' mean?
1) There is only one SRTM30 digital elevation model of the world, so the only difference will be if you use a different polygon for your area, or if you have used the wrong method for the volume calculation.
2) Method: 1 - Count Only Below Base Level: only pixels below the base level will add to the volume.
Thanks for sharing this wonderful work. I do have a question
Can we convert elevation-area-storage capacity into depth-area-storage capacity?
Please correct me if i am wrong.
I think this would be an elevation level ID 2 - an elevation level ID 1 and accumulate them all together to the rest.
Appreciate your through on this.
Thanks
Hi Peter, sorry I don't fully understand your question. We can establish a relationship between any of the three key parameters: elevation, area and storage. In other words we can get a polynomial formula that describes elevation-area, area-elevation, area-storage, storage-area, elevation-storage & storage area.
If you have depth data, I would convert that into an elevation of the water level that you can relate to your DEM. In any case water depth is not a good parameter to use, because reservoirs will tend to silt up so your zero depth level may change over time.
The DEM and all the elevation-area-storage relationships also needs to be updated on a regular basis via bathymetric surveys or you will overestimate the volume in storage as it is reduced over time. This is quite an important issue for all reservoirs. All the best, Andreas
@@GeosearchInternational Sorry if i did not address my question well.
Can we translate or derive the elevation of the reservoir from the DEM into the water depth level? thanks
Hi Peter, can you explain what you mean by "water depth"?
@@GeosearchInternational water level of the reservoir. Thanks
Hi Peter, The topic of my video is how to do this given old elevation-area-storage curves which are not using the same datum as the SRTM digital elevation model. If there is anything you don't understand in the video let me know. All the best, Andreas
This is great, how do i get the excel for this calcs?
Hi Fred, the links to files are always in the description below the video:
QGIS shape files & Reservoir DEM: bit.ly/3Lc70Ws
EXCEL data & calculations: bit.ly/3unSTaz
It opens in Google Drive so just click on the download arrow top right. All the best, Andreas
please can i get the satellite imagery data of kajaki reservoir which is labeled, n32e065 1arc v3
Hi Frank, n32e065 is the 30m DEM which you can download inside QGIS. I think I explained how to do this in the video: ruclips.net/video/vKdUVjDifDY/видео.html The satellite image in the video is just the standard ESRI satellite background. All the best, Andreas
@@GeosearchInternational ok thank you sir
Welcome Frank, All the best, Andreas
3:11 You didn't change the CRS when save DEM. It is projected to ESRI 54034?
Hi KoKoR - well spotted. Indeed it is a mistake. In Step 6, I extract the DEM using the polygon and then it is saved in the correct equal area projection. That is the reason why the end result is OK, though it would have been better to project the DEM at the start. All the best, Andreas