The elevation is from The Global Water Monitor for Lakes & Reservoirs: blueice.gsfc.nasa.gov/gwm/lake/Index. You should also get hold of some actual measured data for comparison. The reservoir area data was extracted from satellite images in Google Earth Engine. All the best, Andreas ******************************************************************* Link to Kajaki reservoir data on Google Drive used for this video EXCEL data & calculations: bit.ly/3Hbo6QX Link to Reservoir Storage Monitoring video: ruclips.net/video/CRIr5ddmWOY/видео.html Video on Reservoir volumes from DEM: ruclips.net/video/SU3csjbq5lA/видео.html Video on Reservoir Elevation-Area-Storage Capacity Curves in Excel: ruclips.net/video/vVuxrQbNWDU/видео.html
Hi Raja, You need to start with the conceptual model on the hydrogeology of the project area: where is the water? Basically if the rocks are not weathered, then the porosity will be very low except where you have fractures. Once we get weathering, the porosity will increase but we can also get clay minerals which can lead to a lower permeability... Weathering is enhanced in fracture zones as the rocks there are already weakened. We also need to consider the water cycle: where is the water coming from? ... and where is it going? Once you have this conceptual model, you can start doing groundwater exploration. Often it is best to look for regional fractures & the way to spot them is on air photos and satellite images. Some fracture directions are better than others so you also need to look at the structural geology of the area. Often late stage extension fractures are a good target, and you may even be able to map them in the field e.g., if they are associated with quartz veins. Once you have found your fractures, and can zero in on those which have a large recharge area and then do some e.g., resistivity profiles to narrow in on the fracture zone, followed by some VES to see how deep you need to drill. See my video on resistivity surveys. If your well is successful you need to carry out careful pumping tests to see if the water levels fully recover, as fractured aquifers can be compartmentalised which means that you can basically pump a particular compartment dry in a short time if it is not hydraulically connected with a larger part of the aquifer. As a general rule, the drier the climate, the harder it is to drill successful wells so it helps to do a good baseline survey before you start any geophysics. Check out my video on groundwater exploration strategy. Good luck & all the best, Andreas
@@GeosearchInternational Andreas.. Thank you very much for detailed explanation. To be specific the study area Geology consist of 10-15m of overburden soil followed by igneous and metamorphic rocks. If we do some VES profiles is it possible to find some fractures. There are lot of equipments in the market claiming that they can identify the water in hard rocks up to a depth of 600m, sadly there is no science behind these techniques. eg. 3D locaters etc. As a Geologist I wanted to know from your experience, how far we can trust the VES sounding for identifying the fractures in hard rocks. Again I say all of your videos are true gems!!
Hi Raja, From my experience all the equipment that make these claims are fake. The laws of physics apply and there is no x-ray equipment for the subsurface. You can do 3D seismic surveys and electrical imaging surveys but even these need to be interpreted professionally and are quite expensive. So, it comes back to good geological & hydrogeological surveys, followed by a logical approach to reduce your risks of failure. A vertical electrical sounding (VES) is just a cheap borehole. It tells you how thick your overburden is and some info on the resistivity. To find the fracture zone, you need to do a resistivity profile, not a VES profile. So the resistivity profile is just repeated resistivity readings at constant AB and MN spacings, say every 10m along a line which is perpendicular to the lineation (fracture zone) which you have picked up using an air photo. When you pass over a fracture zone, the overburden should become thicker as there would have been more erosion - so you can expect a drop in the apparent resistivity values. If your overburden is 15m thick, you need an AB of 3x15=45m - say 50m. If you are in igneous terrain you could also try to find dykes which sometimes act as underground dams. For that a magnetic survey maybe useful. It is always good to talk with local drillers and other people who work in the area, in addition to the baseline survey. Then you can see what work has been done to date & also what approaches have worked or failed. All the best, Andreas
Great video. Have you derived the storage volume vs inundation Area or water level surface elevation relationship for other resvoirs of Afghanistan too?
Thanks Najibullah! I hope that the engineers in the RBAs can do that & compare it with the published curves. For example, the data used by the 2007 USACE modelling study on Kajaki looks wrong. For the newer dams (post year 2000) e.g. the Salma dam - this methodology will work very well, as there was no water in the reservoir at that time. For older dams you would need to digitise old contour maps, but take care with the datums used for the elevations. Also, I think that bathymetric surveys should be done at least once every 10 years, as the reservoirs are filling up so fast with silt. e.g. Kajaki is accumulating about 10 million m3/year. All the best, Andreas
@@GeosearchInternational thank you for the information. Yes some friends did generate the curves for Kamal Khan reservoir. Sadly we have limited information about reservoir sedimentation rate and storage loss in Afg.
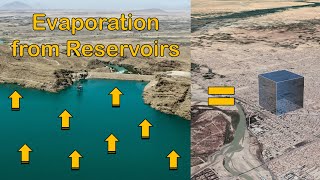
Hi Najibullah, for Kajaki there is an interesting report from 1968 about how they did the bathymetric survey, but nowadays it should be much easier with a depth sounder & differential GPS on a boat. If you don't keep the curves up to date, then you will overestimate the amount of water in the reservoir as it fills with sediments... Sediments are important in reservoirs, but the water lost to evaporation from new reservoirs like Kamal Khan is maybe even more important for the basin water balance - especially in transboundary basins like the Helmand. Another important issue is the over pumping of groundwater for irrigation. As the groundwater levels drop they will induce higher groundwater recharge rates from the Helmand river, which will then have less quantity available to satisfy downstream water demand. If I have time, I will try to make some videos about this. All the best, Andreas
@@GeosearchInternational yes, the region has recently witnessed water related tensions. No doubt the water in lower Helmand basin will play a much larger role in our relationship with Iran. Im currently working on a research paper where I study sediment influx from sand dune migration into the Helmand River and its interaction with fluvial sediment transport. The region is highly interesting to me and to Afghanistan.
Hi Najibullah, Sediment transport is an interesting subject & you must be using a lot of remote sensing for your work. I think it is wonderful that all this satellite data is available for free, as it leads to greater transparency in the region. All the best, Andreas
Hi Asada, I'm still looking for a free and easy to use online resource for this, so if you know of one that works well - please share it with us! At the moment I'm using Goggle Earth Engine with either Sentinel-1 SAR or Sentinel-2 NDWI classification of water pixels & counting the area. All the best, Andreas


It's a very useful tutorial. Thanks Andreas! and your efforts are quite appreciated.
You are welcome Afrah! All the best, Andreas
you did great as usual. thanks
You are welcome Endalkachew! All the best, Andreas
GJ my teacher!
Thanks Muhammad! All the best, Andreas
How to get the elevation and surface area data
The elevation is from The Global Water Monitor for Lakes & Reservoirs: blueice.gsfc.nasa.gov/gwm/lake/Index. You should also get hold of some actual measured data for comparison. The reservoir area data was extracted from satellite images in Google Earth Engine.
All the best, Andreas
*******************************************************************
Link to Kajaki reservoir data on Google Drive used for this video
EXCEL data & calculations: bit.ly/3Hbo6QX
Link to Reservoir Storage Monitoring video: ruclips.net/video/CRIr5ddmWOY/видео.html
Video on Reservoir volumes from DEM: ruclips.net/video/SU3csjbq5lA/видео.html
Video on Reservoir Elevation-Area-Storage Capacity Curves in Excel: ruclips.net/video/vVuxrQbNWDU/видео.html
All are useful videos on your channel. Can you please let me know how to find the water in hard rocks (igneous and metamorphic).
Thanks in advance!
Hi Raja, You need to start with the conceptual model on the hydrogeology of the project area: where is the water? Basically if the rocks are not weathered, then the porosity will be very low except where you have fractures. Once we get weathering, the porosity will increase but we can also get clay minerals which can lead to a lower permeability... Weathering is enhanced in fracture zones as the rocks there are already weakened. We also need to consider the water cycle: where is the water coming from? ... and where is it going?
Once you have this conceptual model, you can start doing groundwater exploration. Often it is best to look for regional fractures & the way to spot them is on air photos and satellite images. Some fracture directions are better than others so you also need to look at the structural geology of the area. Often late stage extension fractures are a good target, and you may even be able to map them in the field e.g., if they are associated with quartz veins.
Once you have found your fractures, and can zero in on those which have a large recharge area and then do some e.g., resistivity profiles to narrow in on the fracture zone, followed by some VES to see how deep you need to drill. See my video on resistivity surveys.
If your well is successful you need to carry out careful pumping tests to see if the water levels fully recover, as fractured aquifers can be compartmentalised which means that you can basically pump a particular compartment dry in a short time if it is not hydraulically connected with a larger part of the aquifer.
As a general rule, the drier the climate, the harder it is to drill successful wells so it helps to do a good baseline survey before you start any geophysics. Check out my video on groundwater exploration strategy. Good luck & all the best, Andreas
@@GeosearchInternational Andreas.. Thank you very much for detailed explanation. To be specific the study area Geology consist of 10-15m of overburden soil followed by igneous and metamorphic rocks. If we do some VES profiles is it possible to find some fractures.
There are lot of equipments in the market claiming that they can identify the water in hard rocks up to a depth of 600m, sadly there is no science behind these techniques. eg. 3D locaters etc.
As a Geologist I wanted to know from your experience, how far we can trust the VES sounding for identifying the fractures in hard rocks.
Again I say all of your videos are true gems!!
Hi Raja, From my experience all the equipment that make these claims are fake. The laws of physics apply and there is no x-ray equipment for the subsurface. You can do 3D seismic surveys and electrical imaging surveys but even these need to be interpreted professionally and are quite expensive. So, it comes back to good geological & hydrogeological surveys, followed by a logical approach to reduce your risks of failure.
A vertical electrical sounding (VES) is just a cheap borehole. It tells you how thick your overburden is and some info on the resistivity. To find the fracture zone, you need to do a resistivity profile, not a VES profile. So the resistivity profile is just repeated resistivity readings at constant AB and MN spacings, say every 10m along a line which is perpendicular to the lineation (fracture zone) which you have picked up using an air photo. When you pass over a fracture zone, the overburden should become thicker as there would have been more erosion - so you can expect a drop in the apparent resistivity values.
If your overburden is 15m thick, you need an AB of 3x15=45m - say 50m. If you are in igneous terrain you could also try to find dykes which sometimes act as underground dams. For that a magnetic survey maybe useful.
It is always good to talk with local drillers and other people who work in the area, in addition to the baseline survey. Then you can see what work has been done to date & also what approaches have worked or failed. All the best, Andreas
@@GeosearchInternational Thank you very much for your detailed explanatiion. Your input is perect for me.
You are welcome Raja! All the best, Andreas
Great video. Have you derived the storage volume vs inundation Area or water level surface elevation relationship for other resvoirs of Afghanistan too?
Thanks Najibullah! I hope that the engineers in the RBAs can do that & compare it with the published curves. For example, the data used by the 2007 USACE modelling study on Kajaki looks wrong. For the newer dams (post year 2000) e.g. the Salma dam - this methodology will work very well, as there was no water in the reservoir at that time. For older dams you would need to digitise old contour maps, but take care with the datums used for the elevations. Also, I think that bathymetric surveys should be done at least once every 10 years, as the reservoirs are filling up so fast with silt. e.g. Kajaki is accumulating about 10 million m3/year. All the best, Andreas
@@GeosearchInternational thank you for the information. Yes some friends did generate the curves for Kamal Khan reservoir. Sadly we have limited information about reservoir sedimentation rate and storage loss in Afg.
Hi Najibullah, for Kajaki there is an interesting report from 1968 about how they did the bathymetric survey, but nowadays it should be much easier with a depth sounder & differential GPS on a boat. If you don't keep the curves up to date, then you will overestimate the amount of water in the reservoir as it fills with sediments... Sediments are important in reservoirs, but the water lost to evaporation from new reservoirs like Kamal Khan is maybe even more important for the basin water balance - especially in transboundary basins like the Helmand. Another important issue is the over pumping of groundwater for irrigation. As the groundwater levels drop they will induce higher groundwater recharge rates from the Helmand river, which will then have less quantity available to satisfy downstream water demand. If I have time, I will try to make some videos about this. All the best, Andreas
@@GeosearchInternational yes, the region has recently witnessed water related tensions. No doubt the water in lower Helmand basin will play a much larger role in our relationship with Iran. Im currently working on a research paper where I study sediment influx from sand dune migration into the Helmand River and its interaction with fluvial sediment transport. The region is highly interesting to me and to Afghanistan.
Hi Najibullah, Sediment transport is an interesting subject & you must be using a lot of remote sensing for your work. I think it is wonderful that all this satellite data is available for free, as it leads to greater transparency in the region. All the best, Andreas
How to find water area data in 12.15 minutes
Hi Asada, I'm still looking for a free and easy to use online resource for this, so if you know of one that works well - please share it with us! At the moment I'm using Goggle Earth Engine with either Sentinel-1 SAR or Sentinel-2 NDWI classification of water pixels & counting the area. All the best, Andreas