How to Change the Vertical Axis (y-axis) Maximum Value, Minimum Value and Major Units in Excel

HTML-код
- Опубликовано: 11 сен 2024
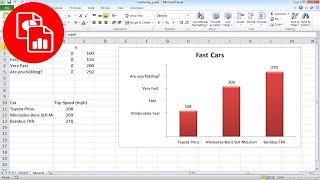
- In this video, you will learn how to change the scale of the vertical axis (y-axis), the maximum value of the vertical axis (y-axis), the minimum value of the vertical axis (y-axis), major units of the vertical axis (y-axis) and minor units of the vertical axis (y-axis) in Excel Graphs or charts using format axis option. This tutorial demonstrates how to change the Y or vertical axis of excel charts to adjust or change the starts and ends at the desired number. In this way, we can control the bounds of excel charts and display values on the vertical axis. Additionally, I will also show you how to make changes in the bounds of a chart through multiple shortcuts in Excel, which is especially important since Excel has changed how to get to these configuration options over the years. You can use a similar procedure to change the scale or bound, maximum and minimum values of the bar, column, or line graph/chart in excel. For this video, I have used Microsoft excel 2016.
#changescale #verticalaxis #excelchart #teachingjunction #yaxis
Watch other RUclips video tutorials on Excel:
How to change horizontal Axis Values in Excel (Bar chart): • 🔥 How to Change Horizo...
How to change horizontal Axis Values in Excel (Line chart): • How to Change Horizont...
How to change vertical Axis Values in Excel (Bar chart): • How to Change the Vert...
How to change vertical Axis Values in Excel (Line chart): • How to Change the Vert...
Other RUclips queries:
How to change the scale of vertical axis in Excel 2016,
Change the Vertical Y Axis Start or End Point in Excel,
How to Change the Scale on an Excel Graph (Super Quick),
How To Change The Range Of The X and Y Axis In Microsoft Excel 2016,
How To Change The Position Of The Horizontal and Vertical Axis in Excel,
How to Adjust the Units in Your Excel Chart's Axes,


THANK YOU THANK YOU THANK YOU....I could not figure out how to change the vertical axis values. I struggled for 2 hours until I came across your tutorial.
You're welcome!
Thank you for this video it helped me alot ❤️
Glad it helped!
Thanks it helped a lot☺☺
You're welcome!
Jzakallah its very helpful and easy to understand
Glad to hear that
This helped me! Thank you!
You're welcome!
Thank you so much!
Glad it helped!
thank you very much 💓💓💓💓💓💓💓💓
Most welcome
thank you very much!!
You're welcome!
Thanks buddy.. it work
You're welcome!
Thank you 😇
You're welcome 😊
thank you
You're welcome
Thanks bro...
Welcome
Thank you!
You're welcome!
Nice
Thanks
is it possible to switch the order of the min and max value?
For example, I want to start from 10 going to 1 (instead of 0 to 10)
If you scroll down, you will find the option of values in reverse order. Check this option. The values of y-axis will be reversed but horizontal axis will be shifted on upper side of graph
here cos in school i didnt know what to do
How to Change Horizontal Axis Values in Excel Charts: ruclips.net/video/AbcYjFTsEoM/видео.html
Ok sir ji
Thanks
doesnt exist on my histogram
Thanks for your feedback. I have note down your suggestion. I will soon cover this topic in my upcoming video
it does not change
After changing the values click on blank cell then you will observe the change. Carefully follow the instructions as explained in the video
Thank you
You're welcome