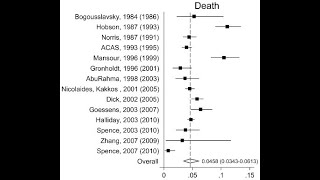
Forest Plot Interpretation - Clearly Explained

HTML-код
- Опубликовано: 25 ноя 2020
- A forest plot is an important part of a meta-analysis. In this video, I will explain what a forest plot actually is and I will clearly explain how to interpret.
HOW I CREATED THIS TUTORIAL (AFFILIATE LINKS)
Screen recorder & editor techsmith.z6rjha.net/c/198849...
RUclips SEO www.tubebuddy.com/SHTeach
Software (Microsoft PowerPoint 365 ProPlus)
FOLLOW US
Website toptipbio.com/
Facebook / toptipbio
Twitter / toptipbio
AFFILIATE DISCLAIMER
Some of the above links are affiliate links, meaning I will earn a commission if a sale is made after clicking on the link.  Хобби
Хобби


Steven, I have spent the last four hours trying to understand this and you did it in 2 minutes :)))))))) love and guidance Steven
Very welcome :)
I absolutely hate watching any 'demo' video which goes longer than 5 minutes when I'm actively trying to do a task. This is by far the best video I have ever watched, I walked away from this with so much confidence!
I feel You are the only one who can explain what I need to understand. Thank you keep going on 🤞
This is literally so simply put up by you. I am impressed
Such a great tutorial and so clearly explained!
this is by far the best video i've watched!! very clear and engaging
This is honestly one of the best videos out there. Saved my life Thank you!
Thanks for the feedback Jeninski!
Genius, thanks for this masterclass!
Thank you so so much !!! Perfect, no suggestions to make!!! Thanks.
Thank you for the clear explanation !
Very well explained within a short time. Thanks a lot!
THANK YOU SO MUCH! I'm a high school senior and I was trying to figure this out for my Biomed Research class!
Thank you for this succinct and informative video!
Great stuff, Steven. Thanks a lot!
Sharp & Clear. Thank you!
You're welcome :)
Thank you for this! Very well explained!
Thanks Emma
Thank you, this has made my presentation very easy ❤
mate your a legend for this
THIS IS THE BEST EXPLANATION AND VERY INFORMATIC...THANK TOU
Thanks a lot for this video! I have an upcoming research presentation and hopefully, i’ll be able to ace it
Thank you for this precise and informative video
Awesome explanation! Thanks a lot
The best explanation of forest plot. Thank you for your vid!
Glad you liked it!
Wow. Was this a clear video! Thank. you!
Great tutorial! Thanks!
Thank you for simplifying our studies, this is the best explanation, it is so clear and helpful.
Best tutorial! Thank you. It is good if you can come with an other video which describe how to perform this type of analysis using different softwares disgined for this purpose like stata.
Great video, thank you!
Best explanation! Thanks.
good one ,well explained.thank you
Thank you for the interpretation:)
Thank you! very clear explanation
Thank you, very informative!!
Very useful. I can understand it well.
Absolutely right! I never comment but this guy did a great job!
I appreciate that!
this is very useful, thank you so much! 🤩
Thanks man, you are a hero! Subscribed and like for sure
Welcome aboard Muhammad!
First love you big chart! So much easier to read
Thank you so much for your valuable information
Best video,well explained thanks
Thank you for your clear explanation :)
Thank you. Very useful well simplified explanation. Thanks so much.
Glad it was helpful!
very clear and concise. tqvm
This is exactly what I need.
thank you so so much! i was so scared + confused by these but i'm not anymore :)
You're welcome!!
Well put sir.thanks for explaining it in such easy way😊
thanks, this video help me a lot!!
Thanks, very useful
Thank you, really helpful
Thankyou for the explaination 😊
thank you, u the best, save my life
Great explaination
Excellent presentation
Thank you man!
It was just great thank you
This was amazing
Thank you sooooo much!!
This video was amazing! I’m in a doctoral program and couldn’t grasp the components in this plot and this explained it perfectly simply. Thank you!
Did you ever get to doing a video on heterogeneity?
great explanation
very helpful explanation
well done!
Excellent explanation!!
Glad you liked it
Bestest..pls make video on umbrella analysis as well..
Awesome
good explanation sir thank you so muchhhhh
very good !
Thank you!!!
Fantastic
thank you so much.
Beautyfull y explained
Thank you!
great video helped me for my test
Good luck with your test 👍
Great video
Glad you enjoyed it
Thank you
Thank you very much. Very well explained. Please make a video on funnel plot and RM vs FM
Thanks! I have these on my to do list :)
thank you
thanks man
Thanks for this informative video. By the way, regarding heterogeneity, does that mean of the heterogeneity p value is greater than the established p value (0.05) then that makes it low heterogeneity?
Thankyou🎉
thank you so much for this tutorial, so useful but please what does it mean the weight of the study ?
Thank you very much for this tutorial video. Allow me to ask one question. What does it mean when the Std, Mean difference is not estimable? I came across that problem recently and i dont know how to interpret it. Thank you in advance
Nice video, very clear. But, anyone have youtube link or title for video that explain heterogeneity and fixed/random effect at this channel like he said before?
thnx❤
Thank u a lot 💗!! But how can we know if it’s risky or protective ? 😰
thank you ill give you subscribe
Hi, Can you please do a video on Funnel Plot? Thanks in advance
👌
need video on prevalence meta analysis, only single group
How it is homogenous and use random effect size ?
I think in homogenous we use fixed effect size only , is not ?
What about pooled prevalence..can you explain it too?
Can we compute for RR, ARR, NNT on continuous effect size?
Hi. Can you pls explain the interpretation of the z-value, how is it calculated, is it different from the z test?
How to perform sensitivity test for subgroup analysis please?
Does anyone know whether meta-analysis is possible with LS mean value ...and Standard error?
I’m confuse on how you calculated the percent weight for each studies, I try it manually but the result is different. Did you use different formula for it?
How do you calculate the weight?
Thank u!but I have a question,When I entered the data, the effect size of group1 was significantly larger than group2, but the diamond was favouring group2. Why?I couldn't change the diamond's bias, but I tried to swap the graph labels for group1 and group2 and ended up favouring group1, which was weird to me.Is that right?
SAME HERE.. The data was clearly indicating that it favors group 1
Hi. Can you tell which article is used in apresentation?
How about when Cohen model is used?
Many thanks for the tutorial. I wanna know how to entering just total number of groups in revman like this video that has group 1 and group 2. I extracted data from articles and just wanna report the total of group 1 and two without any events🙏
My mean is I just wanna have group 1 and group 2 like in your tutorial. Could you create a tutorial video to entering group1 and 2 in Revman? Thanks for your attention
Hi Reihane,
See if this tutorial helps:
ruclips.net/video/uLDbJixeQmY/видео.html
Thanks
Steven
@@StevenBradburn many thanks for your reply, I have watched this video before but in my data I have not any mean or SD or event. I extracted total number of patient and healthy people and want to report just total number like group1 and group2 in your current tutorial video🙏🌹
How do you know which one is the first group?